J Educ Community Health. 10(4):210-216.
doi: 10.34172/jech.2425
Original Article
Well-being and Related Factors of Above 50-Year-Old Population: Based on Ardakan Cohort Study on Aging
Ahmad Delbari 1  , Forough Goudarzi 1, Mohammad Bidkhori 1, Mohammad Saatchi 2, Fatemeh-Sadat Tabatabaei 1, Hassan Rafiey 3, Elham Hooshmand 1, *
Author information:
1Iranian Research Center on Aging, University of Social Welfare and Rehabilitation Sciences, Tehran, Iran
2Department of Biostatistics and Epidemiology, University of Social Welfare and Rehabilitation Sciences, Tehran, Iran
3Social Welfare Management Research Center, University of Social Welfare and Rehabilitation Sciences, Tehran, Iran
Abstract
Background: Well-being is related to various social, psychological, and physical factors. This study investigated these factors and their relationship with the well-being of the elderly.
Methods: This cross-sectional study was conducted based on the data of Ardakan Cohort Study on Aging (ACSA) in 2020, including 5190 people aged 50 and above. The World Health Organization (WHO)-5 questionnaire was used to measure wellbeing. Using a logistic regression model and adjusting the variables, the relationship between well-being and related factors was measured.
Results: Among the participants, 2586 people (49.8%) were women. Well-being was good in 3014 people (58.2%). According to the findings, the poor well-being of the elderly has an inverse and significant relationship with medium to high economic status (OR=0.63, P˂0.001), physical activity (OR=0.99, P˂0.001), and social support (OR=0.90, P˂0.001). The elderly with high school education (OR=1.43, P=0.005) and extremely bad health status (OR=1.32, P=0.008) had poor well-being. Furthermore, the odds of depression (OR=1.21, P=0.035) and anxiety (OR=1.05, P˂0.001) were higher in the elderly who had poor well-being. The mental and physical quality of life were also higher in the group with good well-being (P<0.05).
Conclusion: To promote the elderly’s well-being, they should be involved in regular physical activity, which should be planned to increase their quality of life (physical and mental) and improve their economic status as well as social support.
Keywords: Wellbeing, Elderly, Depression, Social support, Economics
Copyright and License Information
© 2023 The Author(s); Published by Hamadan University of Medical Sciences.
This is an open-access article distributed under the terms of the Creative Commons Attribution License (
http://creativecommons.org/licenses/by/4.0), which permits unrestricted use, distribution, and reproduction in any medium, provided the original work is properly cited.
Please cite this article as follows: Delbari A, Goudarzi F, Bidkhori M, Saatchi M, Tabatabaei FS, Rafiey H, et al. Well-being and related factors of above 50-year-old population: based on ardakan cohort study on aging. J Educ Community Health. 2023; 10(4):210-216. doi:10.34172/jech.2425
Introduction
Well-being in older people may be represented in the areas of behavioral competence, perceived quality of life, psychological well-being, and objective environment (1). Being resilient in the face of adversity, having a sense of belonging and competence, having good relationships with others, and feeling a sense of belonging and participation in a community are examples of experiencing acceptable functioning that is part of sustainable well-being (2). In English-speaking countries, when well-being is evaluated using the life satisfaction measure, the highest level of well-being is observed in young adults and early old age, and it decreases in people aged over 70 years (U-shaped diagram) (3). Many socioeconomic, health, personal, and lifestyle factors have a two-way relationship with wellbeing. For example, good socioeconomic conditions and individual behaviors can increase well-being, and well-being in turn increases the probability of having favorable socioeconomic conditions and positive behaviors(2). Socioeconomic position (SEP) is defined in terms of social and economic factors that affect the positions of participants in the structure of society(4).
The first step to implementing effective interventions is to correctly assess the health status of the target group in view of the growing trend of aging. Socioeconomic conditions are one of the most important aspects of human life and play an important role in the feeling of well-being and increasing the quality of life of the elderly. As such, it is necessary to conduct more studies in different societies and cultures in this field; in addition, obtaining information about these variables can empower policymakers to design appropriate interventions and improve the living conditions of the elderly. Since there have been limited studies in this field on the elderly with a large sample size in Iran, this study was conducted to investigate the well-being of elder individuals in Ardakan (Iran) and to measure its relationship with other possible variables.
Materials and Methods
Samples and Procedure
The data were extracted from a longitudinal study of aging that is a subset of Iranian Longitudinal Study on Ageing (IRLSA) conducted in 2020. The population studied in this research was middle-aged and elderly over 50 years old in Ardakan, Iran. Ardakan is the second largest city in Yazd province, which is located in the center of Iran. The executive personnel consists of the field manager, supervisors, interviewer and technicians, physicians and nurses, support colleagues, and information technology officers who cooperate in the process of studying and completing the questionnaires. To obtain a representative sample, a census was taken through health centers, the contribution of each specific health center was classified, and then people were selected via a multi-stage stratified sampling method to select a sample of individuals aged 50 years or above. The spouse of every person who was included in the sample was also invited to participate in the study if he/she was 50 years old or above. Since this study was population-based, all of the participants in the Ardakan Cohort Study on Aging (ACSA) were included in the current study except people with dementia, major depression, or disabilities which would limit their ability to participate in the study. Finally, 5190 people were selected. Additional details about this study were already given (5).
Measures
In addition to demographic information and living conditions such as retirement, income, and income adequacy, we used the World Health Organization (WHO)-5 well-being scale to measure participants’ well-being.
Wellbeing: Using the WHO-5 questionnaire, people’s wellbeing can be measured, and it is also a tool for depression screening. This questionnaire has 5 questions, and the answers are given on a Likert scale from 0 to 5, where 5 is “excellent, it cannot be better than this” and 0 is “very poor”. The total score is obtained by summing the scores of the questions, which ranges from 0 to 25. The higher the person’s score, the better well-being(6). The reliability and validity of this questionnaire in Persian had been already checked in which Cronbach’s alpha was found to be 0.94 and the optimal cut-off score was < 13 with a sensitivity of 0.68 and a specificity of 0.85(7).
Social Support: The 11-item Duke Social Support Index (DSSI) was used to measure social support. This index includes 4 dimensions of social network, social interaction, mental support, and instrumental support. The score of social support is between 13 and 33, and higher scores reflect more social support. Reliability (Cronbach’s alpha of 0.70) and validity of this index were measured. The availability of social integration showed strong correlations (0.57,0.38, and 0.53) with both the overall score of the DSSI and its two subscales(8).
Physical Activity: Physical activity was measured using the Physical Activity Scale for the Elderly (PASE). This questionnaire has three parts related to leisure time activities, household activities, and work activities, respectively. The total points are between zero and more than 400, and more points mean more physical activity. The validity and reliability of the Persian version of this questionnaire have been measured in previous studies (Cronbach’s alpha = 0.97).(9)
Depression: Center for Epidemiologic Studies Depression Scale (CES-D10) was used to measure depression. The items of this questionnaire are scored on a 4-point Likert scale, ranging from 0 (rarely) or never ( < 1 day), 1 indicates occasionally or in few times (1–2 days), 2 is occasionally or a moderate amount of time (3–4 days), and 3 indicates most of the time or all the time (5–7 days). Moreover, the Persian version was translated and validated by Sharif Nia et al(10).
Anxiety: The Hospital Anxiety and Depression Scale (HADS) was used to measure anxiety. It contains 14 items and consists of two subscales: anxiety and depression. Scores of 11 or more on either subscale are considered to be a significant case of psychological morbidity, while scores of 8–10 represent borderline, and 0–7 is considered normal. We used the anxiety subscale in our study. The validity and reliability of this tool have been measured in Iran(11).
Health-Related Quality of Life (SF-12): The Short-Form Health Survey (SF-12), a shortened form of the SF-36 Health Survey, is an instrument for assessing patient-reported general health conditions. The instrument is categorized to evaluate physical and mental health, each including six items. Scores for items range from 1 to 6. Scores on this questionnaire are in the range of 0–100, where higher scores indicate a better self-perceived health status. The validity and reliability of this questionnaire have been evaluated by Montazeri et al in Iran(12).
Statistical Analysis
The data were analyzed by STATA version 15. The mean and standard deviation (SD) were estimated for quantitative variables, and the absolute and relative frequencies were used for qualitative variables. In regression models, bivariate analysis was performed and the variables that were significant at the significance level of 0.2 were entered into the multivariate model. Furthermore, the stepwise backward method was used to run the model, and variable(s) with a P value less than 0.05 remained in the model.
Results
Among the 5190 participants, 2586 (49.8%) were women. The mean ± SD of the age of the subjects was 62.2 ± 7.7 years, and the well-being of 3014 people (58.0%) was good. There were more men than women in the good well-being group (57.5% vs. 42.5%). On average, 21.2% of the participants were employed, and most people were literate up to elementary school in both groups. The majority of people reported their economic status as average, and 90.4% of people who had better well-being reported their health as good and fairly good, which was more than the other group. In general, the percentage of people who lived with family was higher (92.4%), and the percentage of people living alone was higher in the poor well-being group compared to people who lived with family (7.9% vs. 3.8%). Furthermore, about 32% of the people who had poor well-being also showed symptoms of depression and had a higher anxiety score, and physical activity and social support scores were also lower in these people. The quality of life was divided into two dimensions: mental and physical, and the average score of the elderly’s quality of life was higher in the good well-being group. These variables are presented in Figure 1, and other descriptive statistics are reported in Table 1.
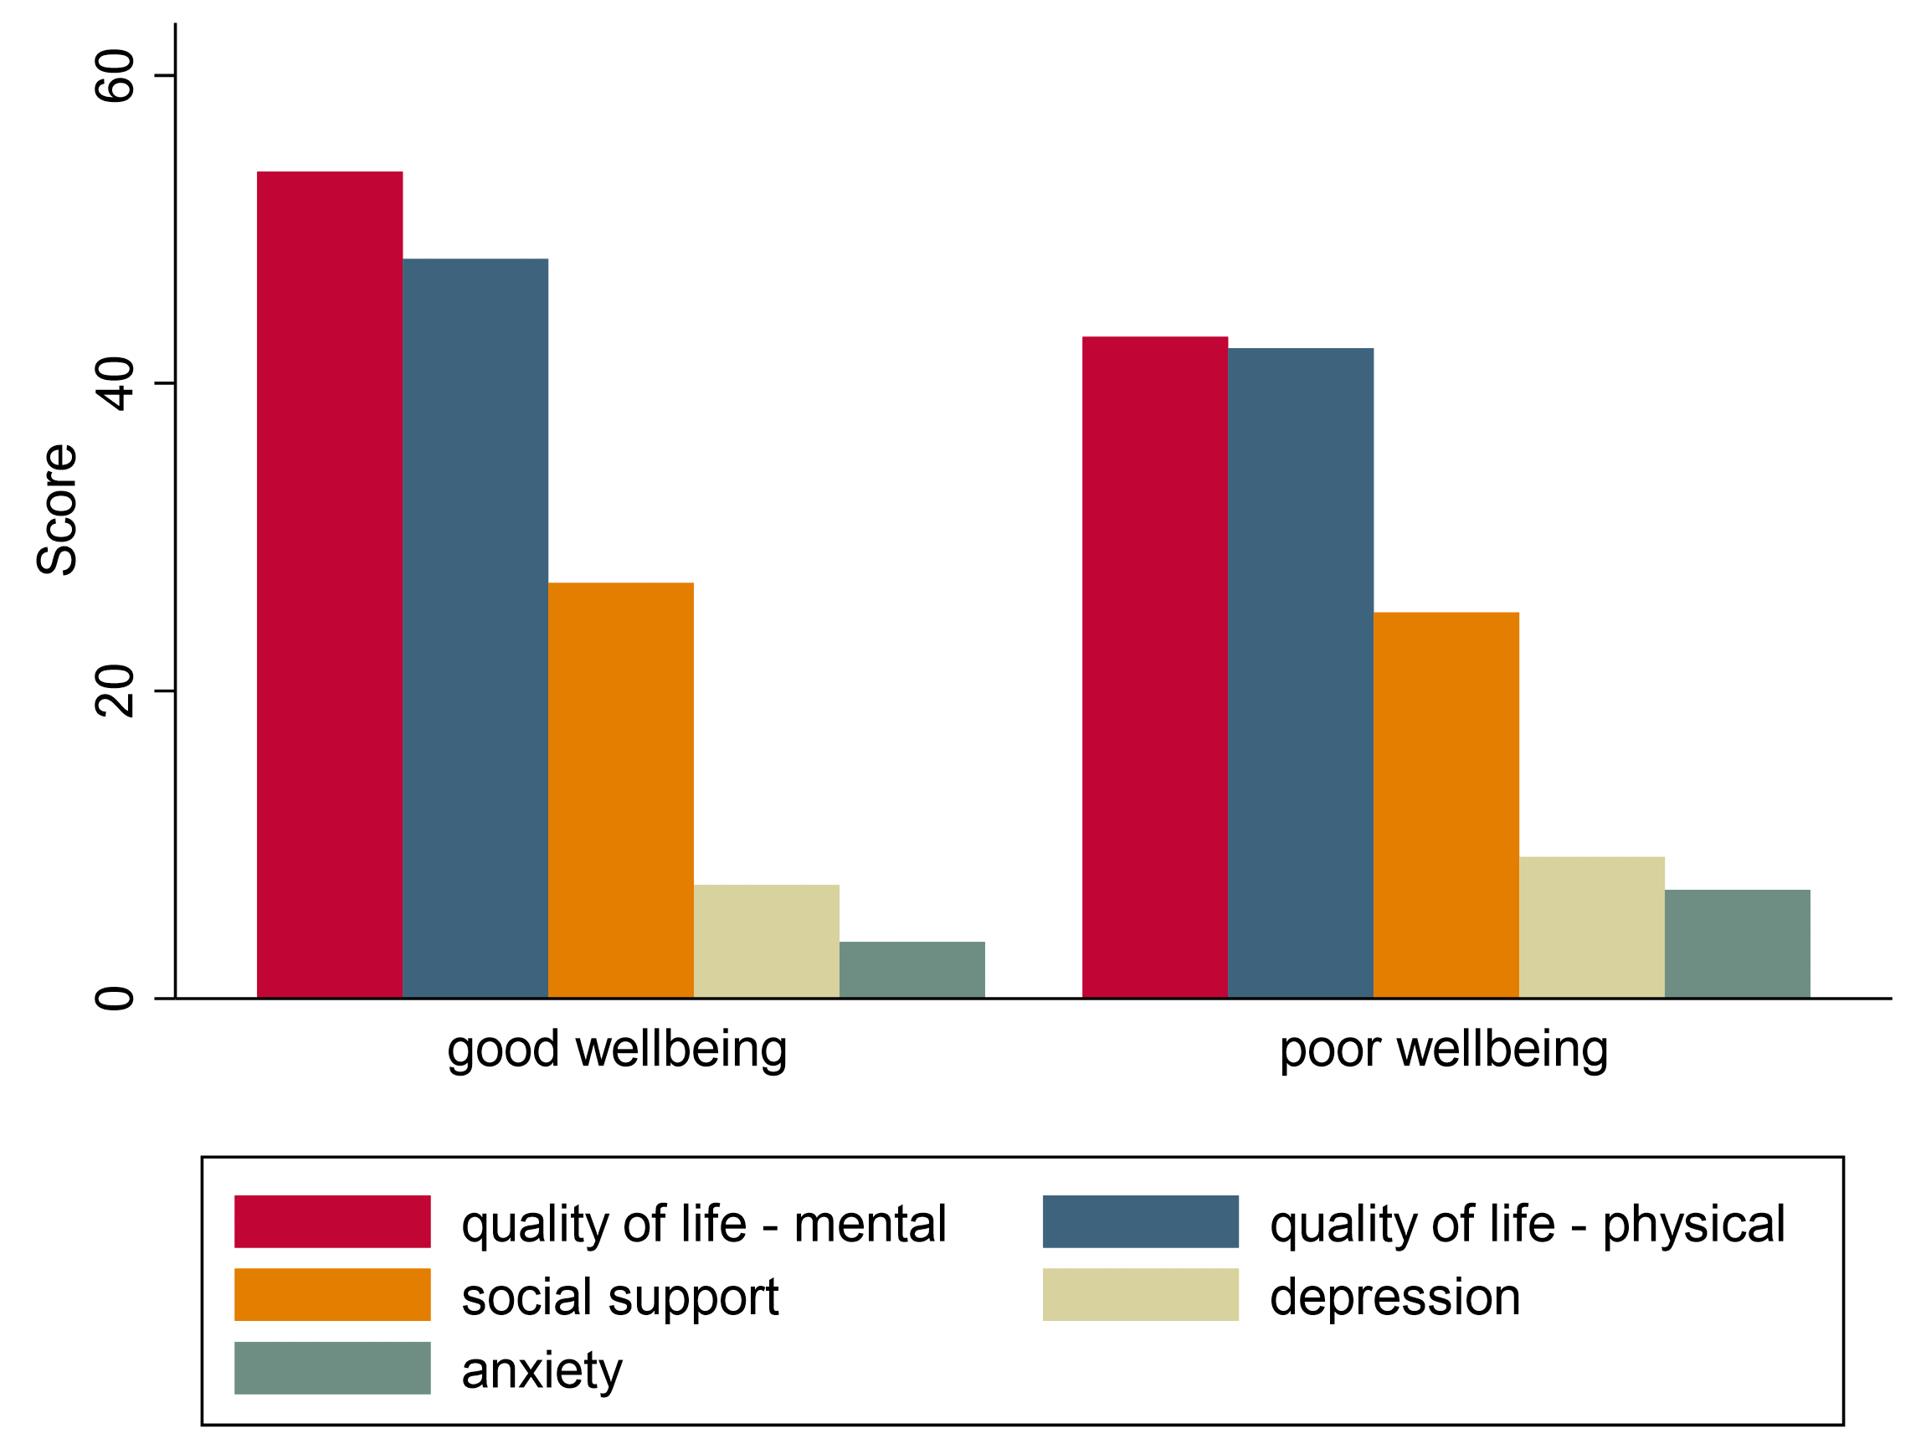
Figure 1.
Social Support, Quality of Life Dimensions, Depression, and Anxiety Score in Older Adults with Good and Poor Well-being
.
Social Support, Quality of Life Dimensions, Depression, and Anxiety Score in Older Adults with Good and Poor Well-being
Table 1.
Basic Characteristics and Independent Factors by Well-being
Variables
No. (%)
|
Wellbeing Status
|
P
Value
|
|
Good (n=3014)
|
Poor (n=2176)
|
| Age (y) ( ≥ 50), mean (SD) |
62.1 (7.7) |
62.5 (7.9) |
0.039 |
| Age group |
|
|
|
| 50-60 |
1283 (42.5) |
873 (40.1) |
< 0.001 |
| > 60 |
1731 (57.5) |
1303 (59.9) |
| Gender |
|
|
|
| Male |
1731 (57.5) |
766 (35.2) |
< 0.001 |
| Female |
1283 (42.5) |
1410 (64.8) |
| Marital status |
|
|
|
| Single* |
183 (6.1) |
287 (13.2) |
< 0.001 |
| Married |
2831 (93.9) |
1889 (86.8) |
| Educational status |
|
|
|
| Illiterate |
332 (11.0) |
400 (18.4) |
< 0.001 |
| Elementary school |
1385 (46.0) |
1091 (50.3) |
| Middle school |
462 (15.6) |
292 (13.5) |
| High school |
399 (13.2) |
223 (10.3) |
| College |
429 (14.2) |
163 (7.5) |
| Current occupational status |
|
|
|
| Retired or disabled or jobless |
1903 (63.3) |
1453 (67.0) |
< 0.001 |
| Employed (part/full time) |
732 (24.3) |
371 (17.1) |
| Other |
372 (12.4) |
345 (15.9) |
| Self-expressed health |
|
|
|
| Very good |
180 (6.0) |
25 (1.1) |
< 0.001 |
| Good |
1198 (40.0) |
319 (14.7) |
| Fair |
1519 (50.4) |
1449 (66.9) |
| Poor |
95 (3.2) |
301 (13.9) |
| Very poor |
11 (0.4) |
73 (3.4) |
| Self-expressed economic level |
|
|
|
| High |
19 (0.7) |
3 (0.1) |
< 0.001 |
| Medium to high |
260 (8.9) |
91 (4.4) |
| Medium |
1549 (53.0) |
911 (43.8) |
| Medium to low |
683 (23.3) |
560 (26.9) |
| Low |
414 (14.1) |
514 (24.7) |
| Living condition |
|
|
|
| Alone |
111 (3.8) |
168 (7.9) |
< 0.001 |
| With family |
2830 (96.2) |
1962 (92.1) |
| Physical activity – PASE, mean (SD) |
152.1 (88.9) |
113.6 (73.1) |
< 0.001 |
| BMI, mean (SD) |
28.3 (4.9) |
29.0 (5.0) |
< 0.001 |
| Social support (Range: 13-33), mean (SD) |
27.0 (2.7) |
25.1 (3.1) |
< 0.001 |
| Anxiety (Range:0-21), mean (SD) |
3.7 (3.3) |
7.1 (4.2) |
< 0.001 |
| Depression - CESD |
|
|
|
| Normal |
2696 (93.2) |
1395 (67.9) |
< 0.001 |
| With depressive symptoms |
195 (6.8) |
660 (32.1) |
| Quality of life (Range: 0-100), mean (SD) |
|
|
|
| Physical |
48.1 (8.4) |
42.3 (11.0) |
< 0.001 |
| Mental |
53.7 (7.1) |
43.0 (10.3) |
Note. BMI, body mass index; SD, standard deviation; PASE, Physical Activity Scale for the Elderly; CESD: Center for Epidemiologic Studies Depression Scale.
* Includes never married, widowed, and divorced.
By examining the questions of the wellbeing questionnaire, it was found that most of the people feel calm and relaxed (36.1%), and their daily life was filled with things that interest them (39.3%) most of the time in the last two weeks. Additionally, more than half of the elderly (53%) woke up refreshed and relaxed. Other details can be seen in Table 2.
Table 2.
WHO Well-being Scale and the Distribution of Responses
Items
(N=5190)
|
All of the Time
|
Most of the Time
|
More than Half of the Time
|
Less than Half of the Time
|
Some of the Time
|
At No Time
|
|
No. (%)
|
No. (%)
|
No. (%)
|
No. (%)
|
No. (%)
|
No. (%)
|
| 1. I have felt cheerful and good spirits. |
268 (5.2) |
1327 (25.6) |
1152 (22.2) |
591 (11.4) |
1258 (24.2) |
595 (11.5) |
| 2. I have felt calm and relaxed. |
546 (10.5) |
1874 (36.1) |
931 (17.9) |
520 (10.0) |
990 (19.1) |
332 (6.4) |
| 3. I have felt active and vigorous. |
432 (8.3) |
1561 (30.1) |
960 (18.5) |
567 (10.9) |
1083 (20.9) |
587 (11.3) |
| 4. I woke up feeling fresh and rested. |
1106 (21.3) |
1649 (31.7) |
593 (11.5) |
345 (6.7) |
764 (14.7) |
733 (14.1) |
| 5. My daily life has been filled with things that interest me. |
303 (5.8) |
2037 (39.3) |
790 (15.2) |
376 (7.2) |
843 (16.3) |
841 (16.2) |
Note. WHO: World Health Organization.
By comparing the well-being score and depression symptoms in people, the average well-being score in the normal group was higher than that in the group with depressive symptoms. However, in general, most people were in a normal state in terms of depression. Dividing people into two groups of well-being, good and poor, it was found that most people with better well-being do not have symptoms of depression (93.2%), while people with poor well-being showed more symptoms of depression than others (32.1%), as depicted in Table 3.
Table 3.
Well-being Status Depending on Depression
|
Wellbeing
|
Depression Status, Mean (SD)
|
P
Value
|
|
Normal
|
With Depressive Symptoms
|
| Total score (0-25) |
14.7 (5.5) |
8.2 (5.3) |
< 0.001 |
| Percent (0-100) |
58.7 (22.0) |
32.8 (21.0) |
< 0.001 |
| Categorical (Cut off: 50), No. (%) |
|
|
|
| Good (n = 2888) |
2693 (93.2) |
195 (6.8) |
< 0.001 |
| Poor (n = 2050) |
1392 (67.9) |
658 (32.1) |
Note. SD: Standard deviation.
The results of the logistic regressions are presented in Table 4. In the bivariate analysis, it can be observed that all the studied variables have a significant relationship with well-being. According to the obtained results, well-being has a significant relationship with the level of education, socioeconomic status, self-reported health status, physical activity, social support, anxiety, depression, and quality of life, so the odds of poor well-being at the high school education level was 1.43 times of the elementary education level (P = 0.005). The poor well-being when a person reports a medium to low economic level was 1.44 times greater than that at medium economic level (P = 0.023), and it was 0.63 times lower than medium economic level in medium to high level (P < 0.001). In addition, the odds of poor well-being in people who stated that they have very bad health status was 1.32 times (P= 0.008) of people who stated that their health status is fair. According to the results, the odds of poor well-being decreased significantly with increasing scores of physical and mental dimensions of quality of life (OR = 0.87 and 0.93, P< 0.001), physical activity (OR = 0.99, P< 0.001), and social support (OR = 0.90, P< 0.001). On the other hand, with an increase in anxiety, the odds of poor well-being increased (OR = 1.05, P-value < 0.001), and the odds of poor well-being in depressed people were 1% higher than that in normal people (OR = 1.21, P= 0.035).
Table 4.
Logistic Regression Results for Factors Associated With Wellbeing* (N:5198)
|
Covariates (Reference Level)
|
Univariable (α<0.2)
|
Multivariable (α<0.05)
|
|
OR
|
95% CI
|
P
Value
|
OR
|
95% CI
|
P
Value
|
| Age, year |
1.007 |
1.00 to 1.01 |
0.039 |
1.00 |
0.99 to 1.01 |
0.253 |
| Gender (male) |
2.49 |
2.23 to 2.79 |
< 0.001 |
1.13 |
0.95 to 1.35 |
0.164 |
| Marital status (married) |
2.35 |
1.94 to 2.86 |
< 0.001 |
1.01 |
0.66 to 1.55 |
0.928 |
| Education (Elementary) |
|
|
< 0.001 |
|
|
|
| Illiterate |
1.51 |
1.28 to 1.79 |
< 0.001 |
1.08 |
0.86 to 1.35 |
0.493 |
| Middle school |
0.80 |
0.67 to 0.94 |
0.010 |
1.04 |
0.83 to 1.31 |
0.685 |
| High school |
0.70 |
0.58 to 0.84 |
< 0.001 |
1.43 |
1.11 to 1.83 |
0.005 |
| College |
0.48 |
0.39 to 0.58 |
< 0.001 |
1.25 |
0.96 to 1.63 |
0.085 |
| Occupation (Not working) |
|
|
< 0.001 |
|
|
|
| Employed |
0.67 |
0.59 to 0.78 |
< 0.001 |
0.96 |
0.79 to 1.17 |
0.741 |
| Other |
1.21 |
1.03 to 1.43 |
0.017 |
0.94 |
0.74 to 1.19 |
0.749 |
| Self-expressed economic level (Medium) |
|
|
< 0.001 |
|
|
|
| High |
0.26 |
0.07 to 0.90 |
0.035 |
0.63 |
0.37 to 1.09 |
0.105 |
| Medium to high |
0.59 |
0.46 to 0.76 |
< 0.001 |
0.63 |
0.53 to 0.77 |
< 0.001 |
| Medium to low |
1.39 |
1.21 to 1.60 |
< 0.001 |
1.44 |
1.05 to 1.98 |
0.023 |
| Low |
2.10 |
1.80 to 2.45 |
< 0.001 |
0.75 |
0.33 to 1.70 |
0.497 |
| Self-expressed health (Fair) |
|
|
< 0.001 |
|
|
|
| Very good |
0.14 |
0.09 to 0.22 |
< 0.001 |
0.44 |
0.09 to 2.16 |
0.316 |
| Good |
0.27 |
0.24 to 0.32 |
< 0.001 |
0.80 |
0.58 to 1.12 |
0.209 |
| Poor |
3.31 |
2.60 to 4.21 |
< 0.001 |
1.19 |
0.99 to 1.42 |
0.052 |
| Very poor |
6.93 |
3.66 to 13.13 |
< 0.001 |
1.32 |
1.07 to 1.63 |
0.008 |
| Living condition (Alone) |
0.45 |
0.35 to 0.58 |
< 0.001 |
0.96 |
0.68 to 1.35 |
0.840 |
| Physical activity – PASE, Score |
0.99 |
0.993 to 0.994 |
< 0.001 |
0.99 |
0.99 to 0.99 |
< 0.001 |
| BMI, kg/m2 |
1.26 |
1.24 to 1.28 |
< 0.001 |
1.00 |
0.98 to 1.01 |
0.896 |
| Social support, Score |
0.79 |
0.78 to 0.81 |
< 0.001 |
0.90 |
0.88 to 0.92 |
< 0.001 |
| Anxiety, Score |
1.26 |
1.24 to 1.28 |
< 0.001 |
1.05 |
1.02 to 1.07 |
< 0.001 |
| Depression (normal) |
6.54 |
5.50 to 7.77 |
< 0.001 |
1.21 |
1.01 to 1.44 |
0.035 |
| Quality of life, Score |
|
|
|
|
|
|
| Physical |
0.94 |
0.93 to 0.94 |
< 0.001 |
0.87 |
0.86 to 0.88 |
< 0.001 |
| Mental |
0.86 |
0.85 to 0.87 |
< 0.001 |
0.93 |
0.92 to 0.94 |
< 0.001 |
|
|
Final Model P value: < 0.001 |
Note. OR, odds ratio; CI, confidence interval; PASE, Physical Activity Scale for the Elderly; BMI, body mass index. * Well-being: Good = 0, Poor = 1. Reference level for wellbeing = Good well-being.
Dropped-out variables in each step: 1. Marital status, 2. BMI, 3. Living conditions, 4. Occupation, 5. Gender, and 6. Age.
Discussion
This study is one of very few studies conducted to investigate the well-being of elder individuals and its related factors in Iran. According to the results, the well-being of more than half of the elderly was good.
In the descriptive analysis, the average age of the people in the two groups of good and poor well-being was found to be almost equal, but when categorizing the people into the two age groups of 50-60 years and over 60 years old, the older people had better well-being. Normally, people over the age of 60 retire and are economically stable, or the stress level of their daily life has decreased, which can have an impact on their well-being. In a global survey of 160 countries, it was found that there is a U-shaped relationship between well-being and age. This survey was conducted between the ages of 45-54 years, and the results may be different in the older age group (3) such as in our study and in other countries(13).
In the current study, men had better well-being than women, which can be related to women’s lower education level. According to research by international organizations, most elderly women are more vulnerable to harm in terms of well-being compared to elderly men(14). Studies demonstrated that marital status often mediates gender differences in well-being among the elderly. It should be noted that in studies related to old age, gender has played a marginal role, and we must adapt an approach that considers the differences and commonalities of men and women as well as their different conditions and problems(15). We should also pay attention to different types of well-being since many biological, individual, and environmental factors may be effective in the difference between the well-being of women and men(16).
It is extremely important to consider the role of other individual and social variables in the well-being of the elderly, and the role of some of these variables has been measured by adjusting the effect of age, gender, marital status, occupation, and living situation in our study. For example, odds of good well-being increase significantly with physical activity, social support, and quality of life (physical and mental), while those with bad self-reported health status have more probability of having poor well-being.
In the present study, living alone was higher in people who had poor well-being. Older people are especially vulnerable to loneliness because of some reasons such as getting older or weaker, no longer being the hub of their family, leaving the workplace, the deaths of spouses and friends, disability, or illness. The contact with children and the love of the spouse was one of the most important needs of the elderly(17). Golden and colleagues’ study showed that loneliness is a risk factor for depression(18), and the results of a systematic review study indicated that social support is related to well-being and depression(19). According to Gyasi and colleagues’ study, social support is significantly related to wellbeing, and contact with family and friends, participation in social events, and emotional bonds are aspects of social support, and strengthening these variables can improve mental health and quality of life of the elderly (20). In old age, people’s well-being is related to different aspects of social networks, so the size and frequency of social networks can be effective in the quality of life and life satisfaction of the elderly, while no significant relationship was observed between the diversity of social networks and individual wellbeing(21).
In this study, those with low self-reported economic status and low self-reported health status had more probability of having poor well-being. In some studies, self-rated health, life satisfaction, and quality of life have been considered measures of well-being, and according to the results of a systematic review, poor social economic status was associated with poor well-being, and there was no significant difference between the gender of the elderly(22). Moreover, a close relationship has been found between health and well-being in the elderly, which can be recognized by life satisfaction, feelings of happiness and sadness, the meaning of life, and a sense of purpose(23). It is clear that people’s health decreases with aging, which can affect the life satisfaction of the elderly(24). The results of a study revealed that well-being is affected by social support, which can predict the overall health of the elderly. Life satisfaction and age are among the factors that have a direct association with overall health(25). The results of studies also showed that the quality of life and health of people are significantly related to their economic status, and a decrease in the level of income leads to a decrease in people’s health and quality of life (26,27). This result may be due to the fact that people with poor economic status have less ability to deal with health-related issues, ultimately leading to a decrease in the quality of health and well-being of people. Additionally, education is a factor that affects the relationship between social support and well-being(20), which is consistent with the results of our study.
Moreover, a significant two-way association was observed between depression and anxiety symptoms and physical activity in such a way that regular physical activity has been associated with a decrease in depression and anxiety symptoms, and the odds of regular physical activity decreased when suffering from depression and anxiety(28). The mechanism of the exercise effects is related to biological and psychological factors, which can be related to a person’s well-being. On the other hand, anxiety and depression are associated with well-being and have a negative effect on it(29). McMahon and colleagues’ study(30) indicated that physical activity has a negative correlation with anxiety and depression symptoms and a positive correlation with well-being, and regular physical activity can increase well-being levels. These physical and psychological factors cannot be separated from each other, and their effects are mutual and interrelated. Additionally, these factors can be related to biological or environmental factors, which are influenced by various variables.
Strengths and Limitations
The use of cohort data and the availability of a reasonable sample size are considered to be the strengths of this study. Furthermore, the adjusted measure of association was reported, so the significant results obtained are not due to the high sample size. Since cohort data were used cross-sectionally, there have been restrictions on the temporal precedence of relationships, and the regression model only indicates the degree of relationship.
Conclusion
According to the results of this study, by adjusting for other variables, it was found that well-being has a significant relationship with mental, physical, and social symptoms, and one factor alone cannot improve or worsen it. The level of education, self-reported economic status, self-reported health status, anxiety, depression, physical activity, social support, and quality of life (physical and mental) are factors affecting the well-being of the elderly.
Increasing activity levels and sports participation among the least active old people should be a target of community interventions to promote well-being. Given the relationship between well-being and quality of life, economic status, and social support in the elderly, it is concluded that appropriate planning should be made to promote well-being and reduce depression and anxiety in these people with the cooperation of experts.
Acknowledgments
We are grateful to all the people who helped us in conducting this study. We would like to thank the officials of the University of Social Welfare and Rehabilitation Sciences as well as the officials of the Ardakan Health Center who facilitated the process of conducting this study.
Authors’ Contribution
Conceptualization: Ahmad Delbari.
Data curation: Elham Hooshmand.
Formal analysis: Mohammad Bidkhori.
Funding acquisition: Ahmad Delbari.
Investigation: Forough Goudarzi, Fatemeh-Sadat Tabatabaei.
Methodology: Mohammad Saatchi, Mohammad Bidkhori.
Project administration: Ahmad Delbari, Elham Hooshmand.
Resources: Ahmad Delbari.
Software: Mohammad Bidkhori.
Supervision: Elham Hooshmand.
Validation: Hassan Rafiey, Elham Hooshmand.
Visualization: Forough Goudarzi.
Writing–original draft: Forough Goudarzi.
Writing–review & editing: Ahmad Delbari, Forough Goudarzi, Mohammad Bidkhori, Mohammad Saatchi, Fatemeh-Sadat Tabatabaei, Hassan Rafiey, Elham Hooshmand.
Competing Interests
The authors have no potential conflict of interests to declare concerning the research, authorship, and/or publication of this article.
Ethical Approval
This study was approved by the University of Social Welfare and Rehabilitation Science (with the ethics code of IR.USWR.REC.1394.490).
Funding
This study was supported by the University of Social Welfare and Rehabilitation Science (grant number: 700151).
References
- Lawton MP. The varieties of wellbeing. Exp Aging Res 1983; 9(2):65-72. doi: 10.1080/03610738308258427 [Crossref] [ Google Scholar]
- Huppert FA. The State of Wellbeing Science: Concepts, Measures, Interventions, and Policies. United Kingdom: John Wiley & Sons; 2014.
- Steptoe A, Deaton A, Stone AA. Subjective wellbeing, health, and ageing. Lancet 2015; 385(9968):640-8. doi: 10.1016/s0140-6736(13)61489-0 [Crossref] [ Google Scholar]
- Hosseinpoor AR, Stewart Williams J, Amin A, Araujo de Carvalho I, Beard J, Boerma T. Social determinants of self-reported health in women and men: understanding the role of gender in population health. PLoS One 2012; 7(4):e34799. doi: 10.1371/journal.pone.0034799 [Crossref] [ Google Scholar]
- Aminisani N, Azimi-Nezhad M, Shamshirgaran SM, Mirhafez SR, Borji A, Poustchi H. Cohort profile: the IRanian Longitudinal Study on Ageing (IRLSA): the first comprehensive study on ageing in Iran. Int J Epidemiol 2022; 51(4):e177-e88. doi: 10.1093/ije/dyab272 [Crossref] [ Google Scholar]
- Topp CW, Østergaard SD, Søndergaard S, Bech P. The WHO-5 Well-Being Index: a systematic review of the literature. Psychother Psychosom 2015; 84(3):167-76. doi: 10.1159/000376585 [Crossref] [ Google Scholar]
- Khosravi A, Mousavi SA, Chaman R, Sepidar Kish M, Ashrafi E, Khalili M. Reliability and validity of the Persian version of the World Health Organization-Five Well-Being Index. Int J Health Stud 2015; 1(1):17-9. doi: 10.22100/ijhs.v1i1.24 [Crossref] [ Google Scholar]
- Goodger B, Byles J, Higganbotham N, Mishra G. Assessment of a short scale to measure social support among older people. Aust N Z J Public Health 1999; 23(3):260-5. doi: 10.1111/j.1467-842x.1999.tb01253.x [Crossref] [ Google Scholar]
- Ishaghi R, Mahmoudian SA, Asgarian R, Sohrabi A. Effect of faith-based education on physical activity on the elderly. Iran J Med Educ 2011;10(5):1281-8. [Persian].
- Sharif Nia H, Rezapour M, Allen KA, Pahlevan Sharif S, Jafari A, Torkmandi H. The psychometric properties of the center for epidemiological studies depression scale (CES-D) for Iranian cancer patients. Asian Pac J Cancer Prev 2019; 20(9):2803-9. doi: 10.31557/apjcp.2019.20.9.2803 [Crossref] [ Google Scholar]
- Montazeri A, Vahdaninia M, Ebrahimi M, Jarvandi S. The Hospital Anxiety and Depression Scale (HADS): translation and validation study of the Iranian version. Health Qual Life Outcomes 2003; 1:14. doi: 10.1186/1477-7525-1-14 [Crossref] [ Google Scholar]
- Montazeri A, Vahdaninia M, Mousavi SJ, Omidvari S. The Iranian version of 12-item Short Form Health Survey (SF-12): factor structure, internal consistency and construct validity. BMC Public Health 2009; 9:341. doi: 10.1186/1471-2458-9-341 [Crossref] [ Google Scholar]
- Steptoe A, Deaton A, Stone AA. Subjective wellbeing, health, and ageing. Lancet 2015; 385(9968):640-8. doi: 10.1016/s0140-6736(13)61489-0 [Crossref] [ Google Scholar]
- Sobieszczyk T, Knodel J, Chayovan N. Gender and wellbeing among older people: evidence from Thailand. Ageing Soc 2003; 23(6):701-35. doi: 10.1017/s0144686x03001429 [Crossref] [ Google Scholar]
- Perrig-Chiello P, Hutchison S. Health and well-being in old age: the pertinence of a gender mainstreaming approach in research. Gerontology 2010; 56(2):208-13. doi: 10.1159/000235813 [Crossref] [ Google Scholar]
- Batz C, Tay L. Gender differences in subjective well-being. In: Diener E, Oishi S, Tay L, eds. Handbook of Well-Being. Salt Lake City, UT: DEF Publishers; 2018.
- Seo S, Jeon J, Chong Y, An J. The relations among relatedness needs, subjective well-being, and depression of Korean elderly. J Women Aging 2015; 27(1):17-34. doi: 10.1080/08952841.2014.929406 [Crossref] [ Google Scholar]
- Golden J, Conroy RM, Bruce I, Denihan A, Greene E, Kirby M. Loneliness, social support networks, mood and wellbeing in community-dwelling elderly. Int J Geriatr Psychiatry 2009; 24(7):694-700. doi: 10.1002/gps.2181 [Crossref] [ Google Scholar]
- Tough H, Siegrist J, Fekete C. Social relationships, mental health and wellbeing in physical disability: a systematic review. BMC Public Health 2017; 17(1):414. doi: 10.1186/s12889-017-4308-6 [Crossref] [ Google Scholar]
- Gyasi RM, Phillips DR, Abass K. Social support networks and psychological wellbeing in community-dwelling older Ghanaian cohorts. Int Psychogeriatr 2019; 31(7):1047-57. doi: 10.1017/s1041610218001539 [Crossref] [ Google Scholar]
- Rafnsson SB, Shankar A, Steptoe A. Longitudinal influences of social network characteristics on subjective well-being of older adults: findings from the ELSA study. J Aging Health 2015; 27(5):919-34. doi: 10.1177/0898264315572111 [Crossref] [ Google Scholar]
- Read S, Grundy E, Foverskov E. Socio-economic position and subjective health and well-being among older people in Europe: a systematic narrative review. Aging Ment Health 2016; 20(5):529-42. doi: 10.1080/13607863.2015.1023766 [Crossref] [ Google Scholar]
- Ilyas Z, Shahed S, Hussain S. An impact of perceived social support on old age well-being mediated by spirituality, self-esteem and ego integrity. J Relig Health 2020; 59(6):2715-32. doi: 10.1007/s10943-019-00969-6 [Crossref] [ Google Scholar]
- Liu J, Wei W, Peng Q, Xue C. Perceived health and life satisfaction of elderly people: testing the moderating effects of social support, attitudes toward aging, and senior privilege. J Geriatr Psychiatry Neurol 2020; 33(3):144-54. doi: 10.1177/0891988719866926 [Crossref] [ Google Scholar]
- Farriol-Baroni V, González-García L, Luque-García A, Postigo-Zegarra S, Pérez-Ruiz S. Influence of social support and subjective well-being on the perceived overall health of the elderly. Int J Environ Res Public Health 2021; 18(10):5438. doi: 10.3390/ijerph18105438 [Crossref] [ Google Scholar]
- Gu L, Cheng Y, Phillips DR, Rosenberg M. Understanding the wellbeing of the oldest-old in China: a study of socio-economic and geographical variations based on CLHLS data. Int J Environ Res Public Health 2019; 16(4):601. doi: 10.3390/ijerph16040601 [Crossref] [ Google Scholar]
- Feng Z, Wang WW, Jones K, Li Y. An exploratory multilevel analysis of income, income inequality and self-rated health of the elderly in China. Soc Sci Med 2012; 75(12):2481-92. doi: 10.1016/j.socscimed.2012.09.028 [Crossref] [ Google Scholar]
- Azevedo Da Silva M, Singh-Manoux A, Brunner EJ, Kaffashian S, Shipley MJ, Kivimäki M. Bidirectional association between physical activity and symptoms of anxiety and depression: the Whitehall II study. Eur J Epidemiol 2012; 27(7):537-46. doi: 10.1007/s10654-012-9692-8 [Crossref] [ Google Scholar]
- Kandola A, Stubbs B. Exercise and anxiety. Adv Exp Med Biol 2020; 1228:345-52. doi: 10.1007/978-981-15-1792-1_23 [Crossref] [ Google Scholar]
- McMahon EM, Corcoran P, O’Regan G, Keeley H, Cannon M, Carli V. Physical activity in European adolescents and associations with anxiety, depression and well-being. Eur Child Adolesc Psychiatry 2017; 26(1):111-22. doi: 10.1007/s00787-016-0875-9 [Crossref] [ Google Scholar]