J Educ Community Health. 11(2):83-90.
doi: 10.34172/jech.2887
Original Article
Examining the Relationship Between Health Perception and Preoperative Anxiety in Surgical Patients
Özlem Şahin Akboğa 1, *  , Yurdagül Günaydın 1, Esra Arıca Özbudak 1
Author information:
1Faculty of Health Sciences, University of Yozgat Bozok, P.O. Box 66100, Center, Yozgat, Turkey
Abstract
Background: A variety of factors can affect anxiety about having surgery. The aim of this study was to determine the level of health perception and preoperative anxiety levels of surgical patients and to investigate the relationship between them.
Methods: This descriptive and correlational study was conducted on 315 surgical patients in the preoperative period in the inner region of Turkey. The data were collected using the "Descriptive Information Form", "Health Perception Scale", and "State-Trait Anxiety Inventory". Multiple regression analyses and structural equation modelling were used to evaluate the data.
Results: The mean scores of the Perception of Health Scale and the State Anxiety Inventory were 43.78±6.52 and 41.10±10.89, respectively. There was a positive relationship between health perception and anxiety. Anxiety explained 1.8% of the health perception score, while age, educational status, income status, health status, hospitalization, history of surgery, and state anxiety scores explained 15% of the health perception score, according to the model created in the study.
Conclusion: Understanding factors affecting preoperative anxiety may help identify patients at high risk of anxiety. Factors that cause anxiety should be investigated, and factors that increase the level of anxiety should be known. The effect of more factors should be investigated to explain preoperative anxiety. Understanding perioperative anxiety in the patient will help provide quality nursing care.
Keywords: Health perception, Preoperative anxiety, Surgery patient
Copyright and License Information
© 2024 The Author(s); Published by Hamadan University of Medical Sciences.
This is an open-access article distributed under the terms of the Creative Commons Attribution License (
https://creativecommons.org/licenses/by/4.0), which permits unrestricted use, distribution, and reproduction in any medium, provided the original work is properly cited.
Please cite this article as follows: Şahin Akboğa Ö, Günaydın Y, Arıca Özbudak E. Examining the relationship between health perception and preoperative anxiety in surgical patients. J Educ Community Health. 2024; 11(2):83-90. doi:10.34172/jech.2887
Introduction
Perception is the neurological process of perceiving, selecting, organizing, and interpreting selected stimuli in light of past experiences, and this process includes the way a person perceives the world (1,2). Perception is also an effective driving force for action (2). Health perception is defined as the combination of personal feelings, thoughts, prejudices, and expectations about one’s own health (3). Health perception, which includes the adoption of healthy lifestyle behaviors, is closely related to the self-improvement process and individuals’ subjective evaluations of their health (4). It is also a strong indicator that reflects the individual’s social well-being, along with physical and mental aspects (5). Studies on the subject have reported that health perception is an important predictor of health outcomes. Health perception affects patients’ quality of life (6), length of hospitalization, and mortality rates (7). Research findings demonstrate negative health perceptions in people with chronic diseases such as chronic obstructive pulmonary disease (8), heart failure (9), and diabetes (10,11). Life changes, such as surgery, cause anxiety. Surgery affects patients psychologically and increases their level of anxiety (12). Anxiety is defined as an emotional response to the expectation of a real, perceived, future, or imminent threat (13). Surgery triggers physical, emotional, and cognitive events that create anxiety (14). The prevalence rate of preoperative anxiety among adult patients worldwide has been reported to range from 11% to 80% (15). In two different studies conducted on the Turkish population, it was reported that the preoperative anxiety of the patients was mild to moderate (16,17). Known risk factors for preoperative anxiety include the presence of psychiatric disorders such as anxiety, depression, and negative clinical experiences (18). Anxiety in the preoperative period is affected by uncertainty, uneasiness, and fear associated with hospitalization, surgery, and anesthesia (19). Preoperative anxiety causes lower patient satisfaction in the postoperative period (20) and prolongs hospital stays (21). The European Society of Anaesthesiology guidelines recommend including patients’ anxiety levels in preoperative patient assessment (22).
Surgery affects the patient both physiologically and psychologically (23). Preoperative anxiety in surgical patients is associated with health perception and postoperative complications (24). A systematic review on this subject revealed that patients who were informed about the surgical process in the preoperative period had lower preoperative anxiety levels, lower postoperative pain and anxiety levels, and faster recovery (25). Patients’ subjective health perceptionssignificantly increased after coronary artery bypass graft surgery, but individuals who did not have family support before surgery and who lived alone exhibited depressive states and increased anxiety levels (26).
The factors affecting the health perception of surgical patients (27) or the effects of health literacy levels on health perception and fear of surgery have been examined (28). Studies on the health perceptions of surgical patients are limited. Although health perception and symptoms of anxiety and depression have been associated in previous studies, especially in recent years (29,30), health perception and preoperative anxiety have not been associated with surgical patients. This study contributed to the literature by explaining the relationship between health perception and preoperative anxiety. In line with this information, this study aims to investigate the occasional relationship between health perception and the preoperative anxiety levels of surgical patients. The research seeks answers to the relationship between health perception and anxiety levels in surgical patients and their effects on each other.
Materials and Methods
Design
This descriptive and cross-sectional study was conducted between January 2023 and March 2023 to determine the relationship between the health perception of surgical patients and anxiety levels in the preoperative period.
Study Population and Sample
The study population included adult patients who underwent surgery in a teaching hospital in the Central Anatolia Region of Turkey. Neurosurgery, cardiovascular, otolaryngology, general surgery, orthopedics, and urology surgeries are performed in this facility. Preoperative patients who were between the ages of 18 and 75 years old and able to communicate were included in the study. On the other hand, patients with cognitive and neurologic disorders and patients undergoing day surgery and emergency surgery were not included in the study. Furthermore, patients whose surgery was canceled were excluded from the study. The G-Power 3.1.9.4 program was used for the sample calculation in this study. The power of the study was estimated to be 81% in a post-hoc power analysis performed with an alpha of a 0.20 confidence interval and a 0.50 effect size. The sample size was found to be sufficient. The sample consisted of 315 individuals who met the inclusion criteria.
Data Collection Tools
The data were collected with the Introductory Information Form”, “Perception of Health Scale (PHS), and “State-Trait Anxiety Inventory (STAI)” prepared in accordance with the literature (27,31-36). The following paragraphs provide these tools in more detail.
Introductory Information Form: Inthis form, which was prepared in line with the literature (27,31,32) and expert opinion, participants were asked 13 questions for personal information, 5 questions for disease-related information, and 18 questions in total.
The Perception of Health Scale: This scale, developed by Diamond et al and validated by Kadıoğlu and Yıldız, shows how a person evaluates his/her own perception of health (33,34). PHS is a five-point Likert-type scale (5 = strongly agree, 1 = strongly disagree) consisting of 15 items and four sub-dimensions, including center of control, certainty, importance of health, and self-awareness. Sample question items of the center of control and certainty included “Being healthy is largely a matter of good fortune” and “I am often confused about what to do to stay healthy”, respectively. Those of importance of health and self-awareness were “I think about my health a lot” and “If I exercise and eat right, I’m almost certain to stay healthy”, respectively. For example, the ‘center of control’ sub-dimension was defined as the perception that the person reflects the disease to his/her own world, regardless of the disease diagnosis. PHS includes positive (Items 1, 5, 9, 10, 11, and 14) and negative (items 2, 3, 4, 6, 7, 8, 12, 13, and 15) statements. Negative statements are reverse-scored, and a minimum of 15 points and a maximum of 75 points are obtained from the scale. Cronbach’s alpha values of the study, which were validated by Kadıoğlu and Yıldız, were 0.90, 0.91, 0.82, and 0.91 for the control of the center, certainty, importance of health, and self-awareness sub-dimensions, respectively (32). In the present study, Cronbach’s alpha was determined to be 0.74, 0.89, 0.80, and 0.69 for the four above-mentioned sub-dimensions, respectively.
State-Trait Anxiety Inventory: This scale, developed by Spielberger et al and validated by Öner and Le Compte, determines the state anxiety level of the individual (35,36). It is a 40-item self-report scale that assesses separate dimensions of “state” and “trait” anxiety. The State Anxiety Inventory consists of 20 items and has a four-point Likert-type scale (1 = none, 2 = somewhat, 3 = a lot, and 4 = completely), and 10 items (1, 2, 5, 8, 10, 11, 15, 16, 19, and 20) are reversely coded. The scale items evaluate the expressed emotions or behaviors according to the severity of the experiences. The total score obtained from the scale varies between 20 and 80, and the level of anxiety increases with an increase in the score (36). In the present study, Cronbach’s alpha was 0.91.
Data Collection
The informed consent form was obtained from the patients who met the inclusion criteria. Data forms were collected by the researchers using the face-to-face interview technique. It took approximately 15 minutes to complete the forms. A total of 350 surgical patients were invited to the study, out of whom 32 refused to participate, and 3 were excluded from the study because they did not complete the questionnaire. Finally, the study was completed with 315 participants.
Data Analysis
The data were evaluated using IBM SPSS Statistics Standard Concurrent User V 26 (IBM Corp., Armonk, New York, USA) statistical package programs. Descriptive statistics were expressed as the number of units (n), percentages (%), means (X), standard deviations (SD), medians (M), and minimum (Min) and maximum (Max) values. The reliability of the scales was analyzed with Cronbach’s alpha coefficient. Scales with a Cronbach’s alpha coefficient above 0.60 were considered reliable. It is decided that the data are normally distributed if the skewness value is below ± 2.0 and the kurtosis value is below 7.0 (37). According to Table 1, it was found that the scale scores were suitable for a normal distribution. In addition, Shapiro-Wilk normality test results showed that the data were normally distributed (P> 0.05). A Student’s t-test was used to compare two groups, and the analysis of variance was utilized to compare variables with more than two categories. Multiple comparisons were made with the Bonferroni test. Normal distribution tests were employed since the skewness was (-2)-(+2) and the kurtosis was below 7. The relationships between numerical variables were analyzed with the Pearson correlation coefficient. The effect of measurements on health perception was evaluated by multiple linear regression analysis. In univariate comparisons, significant characteristics were considered confounding factors, and these variables were included in the regression models. Categorical variables were included in the analyses as dummy variables. The Durbin-Watson value was checked for the autocorrelation between residuals, and P< 0.05 was considered statistically significant.
Table 1.
Comparison of the Effect of Demographic Characteristics on Health Perception Scores (N= 315)
|
|
No. (%)
|
Health Perception Scale
|
Test (P)
|
Difference (Post Hoc)
|
| Age |
|
|
F = 12.603
P < 0.001* |
a < (b = c) |
| 18-34 years old a |
106 (33.70) |
41.38 ± 6.74 |
| 35-65 years old b |
133 (42.20) |
44.56 ± 6.74 |
| Over 65 years old c |
76 (24.10) |
45.78 ± 4.58 |
| Gender |
|
|
t = 0.786
P= 0.432 |
- |
| Female |
175 (55.60) |
43.53 ± 6.88 |
| Male |
140 (44.40) |
44.11 ± 6.03 |
| Education status |
|
|
F = 15.071
P < 0.001* |
a > (b = c) |
| Primary-secondary education a |
170 (54.00) |
45.55 ± 5.34 |
| High school - Associate degree b |
96 (30.50) |
41.97 ± 6.40 |
| Bachelor’s degree c |
49 (15.60) |
41.20 ± 8.48 |
| Marital status |
|
|
t = 1.679
P = 0.094 |
- |
| Married |
255 (81.00) |
44.08 ± 6.37 |
| Single |
60 (19.00) |
42.52 ± 7.01 |
| Area of residence |
|
|
F = 2.243
P = 0.108 |
- |
| City center |
151 (47.90) |
43.15 ± 6.71 |
| District, town |
131 (41.60) |
44.03 ± 6,33 |
| Village, rural area |
33 (10.50) |
45.70 ± 6.07 |
| Living with someone |
|
|
F = 0.815
P = 0.444 |
- |
| Single life |
33 (10.50) |
43.67 ± 6.74 |
| Nuclear family |
258 (81.90) |
43.65 ± 6.37 |
| Extended family |
24 (7.60) |
45.42 ± 7.78 |
| Employment status |
|
|
F = 0.596
P = 0.552 |
- |
| Yes |
84 (26.70) |
43.46 ± 6.31 |
| No |
182 (57.80) |
44.10 ± 7.29 |
| Retired |
49 (15.60) |
44.47 ± 5.89 |
| Income status |
|
|
F = 10.07
P< 0.001* |
a > (b = c) |
| Income lower than expenditure a |
17 (5.40) |
50.41 ± 4.85 |
| Income equal to expenditure b |
186 (59.00) |
43.60 ± 6.16 |
| Income more than expenditure c |
112 (35.60) |
43.08 ± 6.80 |
| Smoking |
|
|
t = 0.484
P = 0.629 |
- |
| There is |
203 (64.40) |
43.92 ± 6.59 |
| None |
112 (35.60) |
43.54 ± 6.40 |
| Alcohol use |
|
|
t = 0.757
P= 0.450 |
- |
| There is |
178 (56.50) |
44.03 ± 6.65 |
| None |
137 (43.50) |
43.47 ± 6.35 |
| Eating pattern |
|
|
F = 1.072
P= 0.344 |
- |
| I never pay attention |
81 (25.70) |
44.65 ± 5.74 |
| I miss it sometimes |
124 (39.40) |
43.66 ± 6.23 |
| Yes |
110 (34.90) |
43.28 ± 7.31 |
| Daily activity |
|
|
F = 0.648
P = 0.524 |
- |
| I never do |
132 (41.90) |
44.27 ± 5.72 |
| I do it occasionally |
115 (36.50) |
43.49 ± 6.45 |
| Yes |
68 (21.60) |
43.34 ± 7.97 |
| Regular doctor check-up |
|
|
t = -0.667
P= 0.505 |
- |
| Yes |
169 (53.70) |
43.56 ± 6.55 |
| No |
146 (46.30) |
44.05 ± 6.49 |
| Health status |
|
|
F = 4.363
P= 0.005* |
a > (b = c = d) |
| Bad a |
23 (7.30) |
47.61 ± 5.20 |
| Medium b |
115 (36.50) |
43.99 ± 6.02 |
| Good c |
151 (47.90) |
43.50 ± 6.72 |
| Very good d |
26 (8.30) |
41.12 ± 7.19 |
| Chronic disease |
|
|
t = -0.929
P= 0.353 |
- |
| There is a |
104 (33.00) |
43.30 ± 7.34 |
| None b |
211 (67.00) |
44.02 ± 6.07 |
| Hospitalization |
|
|
t = 2.346
P= 0.020* |
a > b |
| There is a |
295 (93.70) |
44.01 ± 6.50 |
| None b |
20 (6.30) |
40.50 ± 5.91 |
| History of surgery |
|
|
t = 2.059
P = 0.040* |
a > b |
| There is a |
285 (90.50) |
44.03 ± 6.55 |
| None b |
30 (9.50) |
41.47 ± 5.75 |
Note. ANOVA: Analysis of variance. Student’s t Test (t); ANOVA (F); Descriptive statistics are expressed as means and standard deviations (SD).
* Statistically significant (P< 0.05). Superscripts a, b, c, d in the row indicate the difference between groups.
Results
The results (Table 1) revealed that the mean total health perception scores of people under 35 years of age were statistically lower than those of people over 35 years of age (P< 0.05). The mean total health perception scores of people with primary or secondary education were statistically higher compared to those with high school or higher education (P< 0.05). Based on the findings, the mean total health perception scores of people with low income were statistically higher than those of individuals with medium and high income (P< 0.05). The results further demonstrated that the mean total health perception scores of people with poor health status were statistically higher in comparison to people with moderate and good health status (P< 0.05). The mean total health perception scores of hospitalized people were statistically higher than those of non-hospitalized people (P< 0.05). The obtained data indicated that the mean total health perception scores of people who underwent surgery were statistically higher than those who did not (P< 0.05).
Based on the findings (Table 2), the mean total score of the health perception scale was 43.78 ± 6.52 points. The scale consisted of four dimensions, namely, center of control, certainty, importance of health, and self-awareness. Cronbach’s alpha reliability coefficient of the scale was 0.733, and the mean total score of the state anxiety scale was 41.10 ± 10.89 points. The scale consisted of one dimension. Cronbach’s alpha reliability coefficient of the scale was 0.912. The mean total health perception scores of people under 35 years of age were statistically lower than those of people over 35 years of age (P< 0.05). The results revealed that the mean total health perception scores of people with primary or secondary education were statistically higher compared to those with high school or higher education (P< 0.05). The mean total health perception scores of people with low income were statistically higher than those with medium and high income (P< 0.05).
Table 2.
Descriptive Statistics and Reliability Results for the Scales (N= 315)
|
|
Statistics
|
Number of ıtem
|
Cronbach’s alpha
|
| Center of control |
|
5 |
0.745 |
| Mean ± SD |
16.92 ± 3.71 |
| Median (Min-Max) |
17 (8-25) |
| Certainty |
|
4 |
0.695 |
| Mean ± SD |
12.99 ± 3.05 |
| Median (Min-Max) |
13 (4-20) |
| Importance of health |
|
3 |
0.895 |
| Mean ± SD |
6.40 ± 2.17 |
| Median (Min-Max) |
6 (3-13) |
| Self-awareness |
|
3 |
0.807 |
| Mean ± SD |
7.50 ± 1.92 |
| Median (Min-Max) |
7 (3-13) |
| Mean ± SD |
|
15 |
0.733 |
| Median (Min-Max) |
43.78 ± 6.52 |
| Mean ± SD |
44 (23-64) |
| State anxiety scale |
|
20 |
0.912 |
| Mean ± SD |
41.10 ± 10.89 |
| Median (Min-Max) |
40 (20-72) |
There was a statistically significant positive relationship between health perception and anxiety (P< 0.05). A one-unit increase in the anxiety score could increase the health perception score by 0.081 points. Anxiety explains health perception scores at the level of 1.8% (P< 0.05, Figure 1).
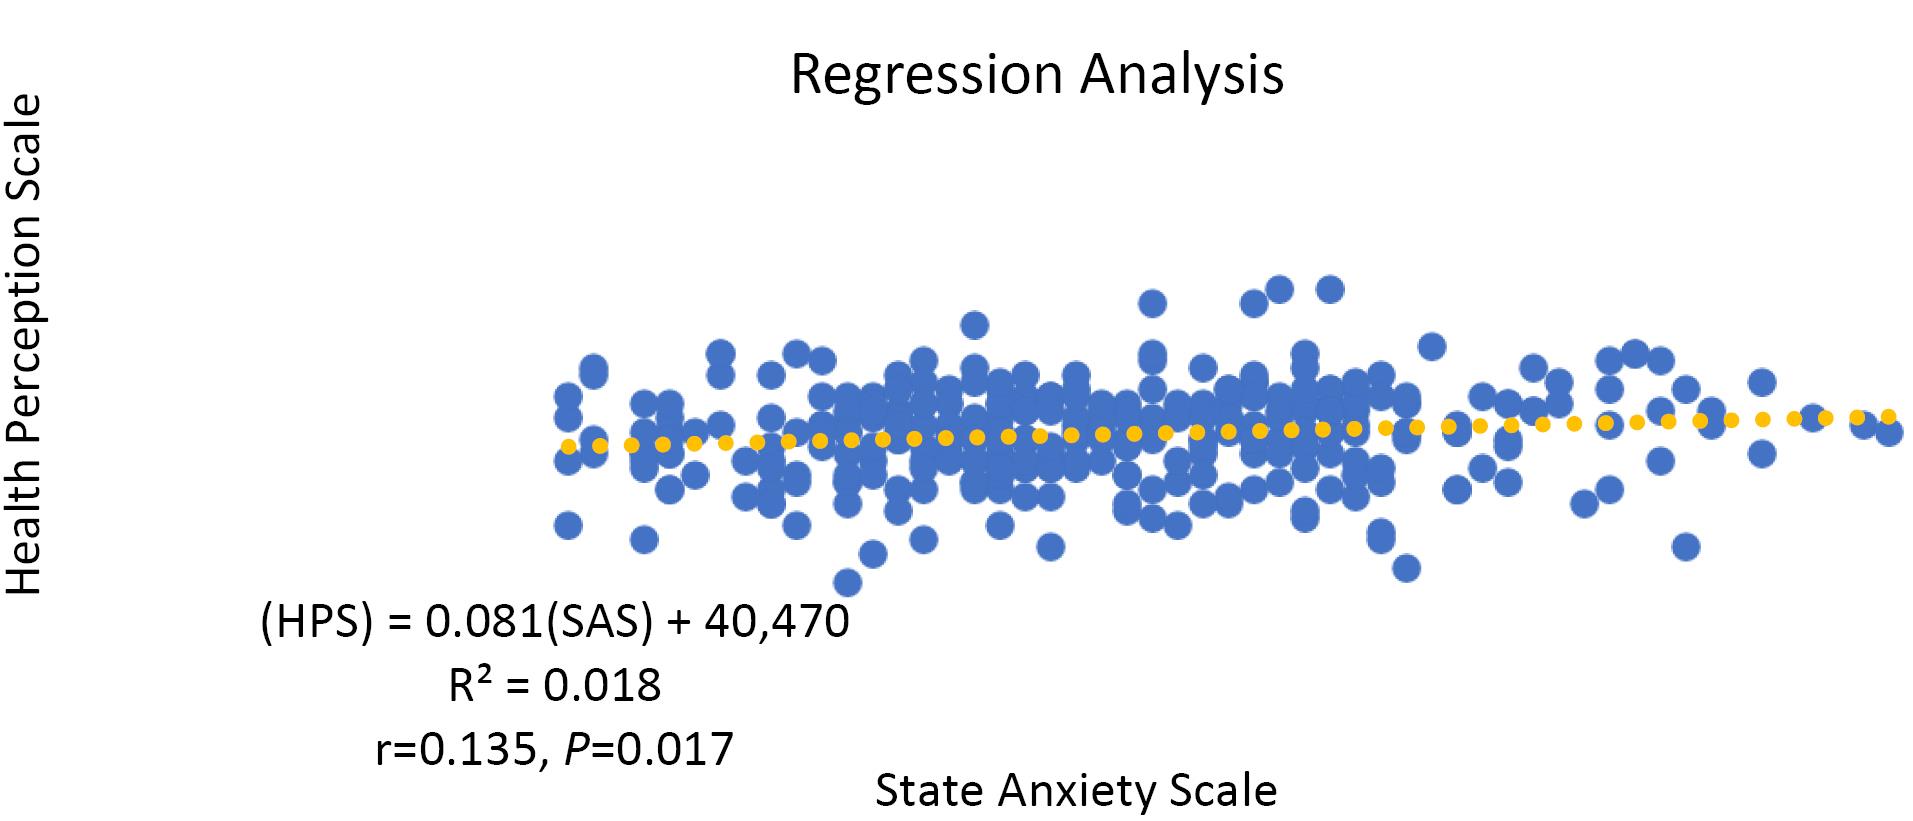
Figure 1.
Relationship Between Health Perception and Anxiety
.
Relationship Between Health Perception and Anxiety
Table 3 presents the data on the effect of age, educational status, income status, health status, hospitalization, history of surgery state, and anxiety scores on health perception scores evaluated by multiple linear regression analysis. The models were statistically significant (F= 7,769, P< 0,001). The Durbin-Watson value was found to be 1.974. According to the model, a one-unit increase in the anxiety score increased the health perception score by 0.077 points. One unit increase in age led to an increase in the health perception score by 1.512 points (P< 0.05). When education increased by one level, the health perception score decreased by 1.765 points (P< 0.05). Although income status, health status, hospitalization, and surgery history were important for the model, the regression coefficients on health perception were not statistically significant (P> 0.05). According to the model, age, educational status, income status, health status, hospitalization, and surgical history could explain the state anxiety scores of health perception at the level of 15%.
Table 3.
The Effect of Health Perception Scores on Anxiety and Demographic Characteristics (N= 315)
|
|
β
|
SE
|
zβ
|
t
|
P
|
95% Confidence Interval for β
|
|
Lower
|
Upper
|
| Model: Health perception |
|
|
|
|
|
|
|
| Constant |
41.469 |
3.033 |
|
13.671 |
0.000 |
35.501 |
47.438 |
| State anxiety |
0.077 |
0.032 |
0.129 |
2.416 |
0.016 |
0.014 |
0.140 |
| Age |
1.512 |
0.492 |
0.175 |
3.074 |
0.002 |
0.544 |
2.480 |
| Education status |
-1.765 |
0.494 |
-0.201 |
-3.570 |
0.000 |
-2.737 |
-0.792 |
| Income status |
-0.907 |
0.647 |
-0.079 |
-1.402 |
0.162 |
-2.181 |
0.367 |
| Health status |
-0.310 |
0.508 |
-0.036 |
-0.611 |
0.542 |
-1.310 |
0.689 |
| Hospitalization |
0.771 |
2.387 |
0.029 |
0.323 |
0.747 |
-3.925 |
5.468 |
| History of surgery |
1.410 |
1.986 |
0.064 |
0.710 |
0.478 |
-2.498 |
5.318 |
DW, Durbin-Watson. Model significance: F = 7.769, P < 0.001, R2 = 0.150, DW = 1.974
Discussion
Measurement of health perception includes assessments of the dimensions of health as well as the physical, mental, and social functionality of perceived well-being (38). It is highly important to determine the health perceptions of patients to ensure compliance with the postoperative period (27). Anxiety, which is common with the stress of having surgery (39,40), may be affected by health perception. This study, which was conducted to examine the relationship between health perception and the preoperative anxiety levels of surgical patients, was discussed within the scope of the literature. The researchers found that there was a positive relationship between health perceptions and state anxiety. Age, educational status, income, health status, hospitalization, history of surgery, and preoperative anxiety were found to have a 15% effect on the health perception of surgical patients.
In another study in which the characteristics of the participants were the same, similar results were observed with this study (41). In addition, it was reported that the health perceptions and anxiety of surgical patients were at a moderate level (28). Although the participants in the current study had moderate levels of health perception and state anxiety and perceived their health status as good (Table 2), we think that patients actually have risk factors that may predispose them to various diseases.
Health perception is an important concept that changes human behavior (42). We found that the health perception and anxiety levels of the participants included in the study were moderate (43.78 ± 6.52 and 41.10 ± 10.89, respectively), and there was a positive relationship between health perception and anxiety. Anxiety explained 1.8% of the health perception score (Figure 1), while age, educational status, income status, health status, hospitalization, history of surgery, and state anxiety scores explained 15% of the health perception score according to the model created in the study (Table 3). Although there are limited studies on the subject, while it was reported that health perception and anxiety levels increased together in pregnant women (43), it was found that there was a significant positive relationship between disease perception and anxiety level of surgical patients in the preoperative period (44). The health perception level of patients who underwent cardiac surgery was significantly lower than that of patients who did not undergo cardiac surgery (45). Furthermore, it has been demonstrated that the anxiety level of patients who would undergo major surgery has been significantly higher in the preoperative period (46,47). Further, although interventions such as open heart surgery are frightening for patients, it has been reported that the health perceptions of patients over 70 years of age have increased after heart surgery compared to before heart surgery (48). These studies revealed that health perception increases with a decrease in anxiety levels. However, individuals with good health perceptions may experience higher levels of anxiety. Anxiety about one’s health perception is a motivating force in leading healthy life behaviors. Health perception affects the development of positive behaviors related to the disease, adaptation to the disease, and improvement of functional status (41). The high state-trait anxiety level in individuals with high health perception may be related to the patient’s ability to obtain information in the preoperative period, to understand the medical information obtained, and to interpret and evaluate this information. Accordingly, knowledge of the disease and its consequences can be considered a factor that increases the state-trait anxiety level. A high positive health perception may not always have a positive effect on preoperative anxiety. In this study, the level of state anxiety had a direct predictive effect on patients’ perceptions of health, but when other mediating factors intervened, the effect on anxiety increased as much as possible.
Limitations Research
There are few studies on this subject, and the results can only be generalized to this patient group since the research was conducted on patients who had surgery at the surgical clinics of the hospital where the research was conducted. The reliability of the data reported here is limited to the information provided by the patients since the data have been collected with questionnaire forms using the face-to-face interview method.
Conclusion
This study examined the effects of primarily state anxiety and mediating factors on the preoperative health perception of surgical patients. The researchers found that there was a positive relationship between health perceptions and state anxiety. Age, educational status, income, health status, hospitalization, history of surgery, and preoperative anxiety were found to have a 15% effect on the health perception of surgical patients. More comprehensive studies should be conducted on the rates of factors affecting health perception. Surgical nurses should attempt to understand their patients’ preoperative anxiety and the factors affecting this parameter. Understanding the cause of preoperative anxiety will help reduce anxiety in patients.
Authors’ Contribution
Conceptualization: Özlem Şahin Akboğa, Yurdagül Günaydın.
Data curation: Özlem Şahin Akboğa, Esra Arıca Özbudak.
Formal analysis: Özlem Şahin Akboğa, Yurdagül Günaydın.
Funding acquisition: Özlem Şahin Akboğa.
Investigation: Özlem Şahin Akboğa, Yurdagül Günaydın, Esra Arıca Özbudak.
Methodology: Özlem Şahin Akboğa, Yurdagül Günaydın.
Project administration: Özlem Şahin Akboğa.
Resources: Özlem Şahin Akboğa.
Software: Özlem Şahin Akboğa, Yurdagül Günaydın.
Supervision: Özlem Şahin Akboğa, Yurdagül Günaydın.
Validation: Özlem Şahin Akboğa, Yurdagül Günaydın.
Visualization: Özlem Şahin Akboğa.
Writing–original draft: Özlem Şahin Akboğa, Yurdagül Günaydın.
Writing–review & editing: Özlem Şahin Akboğa, Yurdagül Günaydın, Esra Arıca Özbudak.
Competing Interests
None declared.
Ethical Approval
Before starting the research, ethical approval was obtained from the local ethics committee (Decision No. 01/26 Date: January 25, 2023) and then institutional permission. Patients participating in the research also gave written informed consent.
Funding
The authors declared that this study has received no financial support.
References
- Bunting SM. The concept of perception in selected nursing theories. Nurs Sci Q 1988; 1(4):168-74. doi: 10.1177/089431848800100410 [Crossref] [ Google Scholar]
- McDonald SM. Perception: a concept analysis. Int J Nurs Knowl 2012; 23(1):2-9. doi: 10.1111/j.2047-3095.2011.01198.x [Crossref] [ Google Scholar]
- Seval Ağaçdiken S, Özdelikara A, Mumcu Boğa N. Determination of nursing students’ health perception. Gumushane Univ J Health Sci 2017; 6(2):11-21. [ Google Scholar]
- Bottorff JL, Johnson JL, Ratner PA, Hayduk LA. The effects of cognitive-perceptual factors on health promotion behavior maintenance. Nurs Res 1996; 45(1):30-6. doi: 10.1097/00006199-199601000-00006 [Crossref] [ Google Scholar]
- Schmidt M. Predictors of self-rated health and lifestyle behaviours in Swedish university students. Glob J Health Sci 2012; 4(4):1-14. doi: 10.5539/gjhs.v4n4p1 [Crossref] [ Google Scholar]
- Schuler BR. Health perceptions and quality of life among low-income adults. Health Soc Work 2015; 40(3):225-32. doi: 10.1093/hsw/hlv045 [Crossref] [ Google Scholar]
- Carson P, Tam SW, Ghali JK, Archambault WT, Taylor A, Cohn JN. Relationship of quality of life scores with baseline characteristics and outcomes in the African-American heart failure trial. J Card Fail 2009; 15(10):835-42. doi: 10.1016/j.cardfail.2009.05.016 [Crossref] [ Google Scholar]
- Nguyen HQ, Donesky-Cuenco D, Carrieri-Kohlman V. Associations between symptoms, functioning, and perceptions of mastery with global self-rated health in patients with COPD: a cross-sectional study. Int J Nurs Stud 2008; 45(9):1355-65. doi: 10.1016/j.ijnurstu.2007.09.012 [Crossref] [ Google Scholar]
- Heo S, Shin MS, Jang AY, Kim MY, Lopes CT, Kim J. Factors associated with changes in health perception in patients with heart failure. West J Nurs Res 2021; 43(12):1125-31. doi: 10.1177/0193945921992540 [Crossref] [ Google Scholar]
- Jang Y, Park NS, Cho S, Roh S, Chiriboga DA. Diabetes and depressive symptoms among Korean American older adults: the mediating role of subjective health perceptions. Diabetes Res Clin Pract 2012; 97(3):432-7. doi: 10.1016/j.diabres.2012.03.018 [Crossref] [ Google Scholar]
- Dalbo VJ, Teramoto M, Roberts MD, Scanlan AT. Lack of reality: positive self-perceptions of health in the presence of disease. Sports (Basel) 2017; 5(2):23. doi: 10.3390/sports5020023 [Crossref] [ Google Scholar]
- Bedaso A, Ayalew M. Preoperative anxiety among adult patients undergoing elective surgery: a prospective survey at a general hospital in Ethiopia. Patient Saf Surg 2019; 13:18. doi: 10.1186/s13037-019-0198-0 [Crossref] [ Google Scholar]
- American Psychiatric Association (APA). Diagnostic and Statistical Manual of Mental Disorders: DSM-5. Washington, DC: APA; 2013.
- Sigdel S. Perioperative anxiety: a short review. Glob Anesth Perioper Med 2015; 1(4):107-8. doi: 10.15761/gapm.1000126 [Crossref] [ Google Scholar]
- Bedaso A, Mekonnen N, Duko B. Prevalence and factors associated with preoperative anxiety among patients undergoing surgery in low-income and middle-income countries: a systematic review and meta-analysis. BMJ Open 2022; 12(3):e058187. doi: 10.1136/bmjopen-2021-058187 [Crossref] [ Google Scholar]
- Erkilic E, Kesimci E, Soykut C, Doger C, Gumus T, Kanbak O. Factors associated with preoperative anxiety levels of Turkish surgical patients: from a single center in Ankara. Patient Prefer Adherence 2017; 11:291-6. doi: 10.2147/ppa.s127342 [Crossref] [ Google Scholar]
- Demirel A, Balkaya AN, Onur T, Karaca Ü, Onur A. The effect of health literacy on preoperative anxiety levels in patients undergoing elective surgery. Patient Prefer Adherence 2023; 17:1949-61. doi: 10.2147/ppa.s419866 [Crossref] [ Google Scholar]
- Fentie Y, Yetneberk T, Gelaw M. Preoperative anxiety and its associated factors among women undergoing elective caesarean delivery: a cross-sectional study. BMC Pregnancy Childbirth 2022; 22(1):648. doi: 10.1186/s12884-022-04979-3 [Crossref] [ Google Scholar]
- Mekonnen Abate S, Chekol YA, Basu B. Global prevalence and determinants of preoperative anxiety among surgical patients: a systematic review and meta-analysis. Int J Surg Open 2020; 25:6-16. doi: 10.1016/j.ijso.2020.05.010 [Crossref] [ Google Scholar]
- Theunissen M, Peters ML, Bruce J, Gramke HF, Marcus MA. Preoperative anxiety and catastrophizing: a systematic review and meta-analysis of the association with chronic postsurgical pain. Clin J Pain 2012; 28(9):819-41. doi: 10.1097/AJP.0b013e31824549d6 [Crossref] [ Google Scholar]
- Pompe RS, Krüger A, Preisser F, Karakiewicz PI, Michl U, Graefen M. The impact of anxiety and depression on surgical and functional outcomes in patients who underwent radical prostatectomy. Eur Urol Focus 2020; 6(6):1199-204. doi: 10.1016/j.euf.2018.12.008 [Crossref] [ Google Scholar]
- De Hert S, Staender S, Fritsch G, Hinkelbein J, Afshari A, Bettelli G. Pre-operative evaluation of adults undergoing elective noncardiac surgery: updated guideline from the European Society of Anaesthesiology. Eur J Anaesthesiol 2018; 35(6):407-65. doi: 10.1097/eja.0000000000000817 [Crossref] [ Google Scholar]
- Siddaiah-Subramanya M, To H, Haigh C. The psychosocial impact of surgical complications on the operating surgeon: a scoping review. Ann Med Surg (Lond) 2021; 67:102530. doi: 10.1016/j.amsu.2021.102530 [Crossref] [ Google Scholar]
- Tulloch I, Rubin JS. Assessment and management of preoperative anxiety. J Voice 2019; 33(5):691-6. doi: 10.1016/j.jvoice.2018.02.008 [Crossref] [ Google Scholar]
- Ayyadhah Alanazi A. Reducing anxiety in preoperative patients: a systematic review. Br J Nurs 2014; 23(7):387-93. doi: 10.12968/bjon.2014.23.7.387 [Crossref] [ Google Scholar]
- Okkonen E, Vanhanen H. Family support, living alone, and subjective health of a patient in connection with a coronary artery bypass surgery. Heart Lung 2006; 35(4):234-44. doi: 10.1016/j.hrtlng.2005.11.002 [Crossref] [ Google Scholar]
- Türe Yilmaz A, Çulha İ, Kersu Ö, Gümüş D, Ünsal A, Köşgeroğlu N. Affecting factors and health perceptions of surgical patients. J Acad Soc Sci 2018; 6(68):89-99. doi: 10.16992/asos.13536 [Crossref] [ Google Scholar]
- Çetin F, Yılmaz E. The effects of health literacy levels of patients in surgical clinic on health perception and surgical fear. İzmir Kâtip Çelebi University Faculty of Health Sciences Journal 2022; 7(1):61-7. [ Google Scholar]
- Lawson CA, Solis-Trapala I, Dahlstrom U, Mamas M, Jaarsma T, Kadam UT. Comorbidity health pathways in heart failure patients: a sequences-of-regressions analysis using cross-sectional data from 10,575 patients in the Swedish Heart Failure Registry. PLoS Med 2018; 15(3):e1002540. doi: 10.1371/journal.pmed.1002540 [Crossref] [ Google Scholar]
- Lerdal A, Hofoss D, Gay CL, Fagermoen MS. Perception of illness among patients with heart failure is related to their general health independently of their mood and functional capacity. J Patient Rep Outcomes 2019; 3(1):55. doi: 10.1186/s41687-019-0142-1 [Crossref] [ Google Scholar]
- Kaya S. The Relations Between Fatigue and Health Perception of the Patients Undergoing Coronary Artery Bypass Graft Surgery [dissertation]. Institute of Health Sciences; 2014.
- Heo S, Shin MS, Jang AY, Kim MY, Lopes CT, Kim J. Factors associated with changes in health perception in patients with heart failure. West J Nurs Res 2021; 43(12):1125-31. doi: 10.1177/0193945921992540 [Crossref] [ Google Scholar]
- Diamond JJ, Becker JA, Arenson CA, Chambers CV, Rosenthal MP. Development of a scale to measure adults’ perceptions of health: preliminary findings. J Community Psychol 2007; 35(5):557-61. doi: 10.1002/jcop.20164 [Crossref] [ Google Scholar]
- Kadıoğlu H, Yıldız A. Validity and reliability of Turkish version of perception of health scale. Turk Klin J Med Sci 2012; 32(1):47-53. doi: 10.5336/medsci.2010-21761 [Crossref] [ Google Scholar]
- Spielberger CD, Gorsuch RC, Luschene RE. Manual for the State-Trait Anxiety Inventory. California: Consulting Psychologists Press; 1970.
- Öner N, Le Compte WA. State-Trait Anxiety Inventory Handbook. Istanbul: Boğaziçi University Press; 1983.
- Kim HY. Statistical notes for clinical researchers: assessing normal distribution (2) using skewness and kurtosis. Restor Dent Endod 2013; 38(1):52-4. doi: 10.5395/rde.2013.38.1.52 [Crossref] [ Google Scholar]
- Şenol V. The Use of Health Services in Kayseri City Center and its Relationship with Perceived Health [dissertation]. Kayseri: Erciyes University; 2006.
- Wetsch WA, Pircher I, Lederer W, Kinzl JF, Traweger C, Heinz-Erian P. Preoperative stress and anxiety in day-care patients and inpatients undergoing fast-track surgery. Br J Anaesth 2009; 103(2):199-205. doi: 10.1093/bja/aep136 [Crossref] [ Google Scholar]
- Nigussie S, Belachew T, Wolancho W. Predictors of preoperative anxiety among surgical patients in Jimma University Specialized Teaching Hospital, South Western Ethiopia. BMC Surg 2014; 14:67. doi: 10.1186/1471-2482-14-67 [Crossref] [ Google Scholar]
- Yiğitalp G, Bayram Değer V, Çifçi S. Health literacy, health perception and related factors among different ethnic groups: a cross-sectional study in southeastern Turkey. BMC Public Health 2021; 21(1):1109. doi: 10.1186/s12889-021-11119-7 [Crossref] [ Google Scholar]
- Ferrer R, Klein WM. Risk perceptions and health behavior. Curr Opin Psychol 2015; 5:85-9. doi: 10.1016/j.copsyc.2015.03.012 [Crossref] [ Google Scholar]
- Gün Kakaşçı Ç, Durmaz A. Evaluation of belief in COVID-19 myths and levels of COVID-19 anxiety and perception of health in pregnancy. Karya J Health Sci 2022; 3(2):93-7. doi: 10.52831/kjhs.1101468 [Crossref] [ Google Scholar]
- Şavk A, Kebapçı E, Özcan S. Determination of disease perception and anxiety level in preoperative surgery patients. J Tepecik Educ Res Hosp 2022; 32(1):85-92. doi: 10.4274/terh.galenos.2021.34101 [Crossref] [ Google Scholar]
- Cotts T, Malviya S, Goldberg C. Quality of life and perceived health status in adults with congenitally corrected transposition of the great arteries. J Thorac Cardiovasc Surg 2012; 143(4):885-90. doi: 10.1016/j.jtcvs.2011.08.031 [Crossref] [ Google Scholar]
- Mulugeta H, Ayana M, Sintayehu M, Dessie G, Zewdu T. Preoperative anxiety and associated factors among adult surgical patients in Debre Markos and Felege Hiwot referral hospitals, Northwest Ethiopia. BMC Anesthesiol 2018; 18(1):155. doi: 10.1186/s12871-018-0619-0 [Crossref] [ Google Scholar]
- Kassahun WT, Mehdorn M, Wagner TC, Babel J, Danker H, Gockel I. The effect of preoperative patient-reported anxiety on morbidity and mortality outcomes in patients undergoing major general surgery. Sci Rep 2022; 12(1):6312. doi: 10.1038/s41598-022-10302-z [Crossref] [ Google Scholar]
- Chocron S, Tatou E, Schjoth B, Naja G, Clement F, Viel JF. Perceived health status in patients over 70 before and after open-heart operations. Age Ageing 2000; 29(4):329-34. doi: 10.1093/ageing/29.4.329 [Crossref] [ Google Scholar]