J Educ Community Health. 12(3):194-203.
doi: 10.34172/jech.3548
Original Article
Effect of an Educational Tool Based on Social Cognitive Theory on Height Literacy and Healthy Behaviors in School-Aged Children in Mae Hong Son, Thailand
Siwaporn Mahathamnuchock 1, * 
Author information:
1Mae Hong Son College, Chiang Mai Rajabhat University, Mae Hong Son Province, Thailand. 236 Moo 3, Pangmoo Subdistrict, Mueang Mae Hong Son District, Mae Hong Son Province 58000, Thailand
Abstract
Background: Height assessment is essential for monitoring child development. Accordingly, this study aimed to develop and evaluate educational tools (Soong-dee magnet graph) based on Social Cognitive Theory (SCT) to enhance height literacy and promote healthy behaviors among school-aged children in Mae Hong Son Province, Thailand, in 2023.
Methods: A quasi-experimental one-group pretest-posttest design was employed to evaluate the impact of the height-promotion intervention. Sixty students (male: n=31, 51.70%; female: n=29, 48.30%), aged 9–14 years, were selected using systematic sampling. Demographic, height literacy, health behavior questionnaires and the Soong-dee magnet graph were utilized for data collection. Eventually, the obtained data were analyzed using descriptive statistics and paired-sample t-tests to assess changes in knowledge and behavior before and after the intervention (P<0.05).
Results: After four months of intervention, the height and weight of the students increased, with a noticeable increase in the height literacy and health behavior scores (P<.001).
Conclusion: Our findings revealed that an SCT-based educational tool could effectively promote height literacy and healthy behaviors in school-aged children highlighting the potential of simple visual tools to promote health education and well-being in underserved communities.
Keywords: Height literacy, Health behaviors, School-aged children, Thailand
Copyright and License Information
© 2025 The Author(s); Published by Hamadan University of Medical Sciences.
This is an open-access article distributed under the terms of the Creative Commons Attribution License (
https://creativecommons.org/licenses/by/4.0), which permits unrestricted use, distribution, and reproduction in any medium, provided the original work is properly cited.
Please cite this article as follows: Mahathamnuchock S. Effect of an educational tool based on social cognitive theory on height literacy and healthy behaviors in school-aged children in Mae Hong Son, Thailand. J Educ Community Health. 2025; 12(3):194-203. doi:10.34172/jech.3548
Introduction
Monitoring growth and development requires an assessment of height, particularly in children living in rural areas with limited resources and access to healthcare services due to disparities. Rapid height growth is a significant indicator of nutritional status and overall health in children aged 6–12 (1). More precisely,height reflects both individual well-being and broader social and economic conditions (2).Stunted growth, often caused by malnutrition or health issues, can impair cognitive development, learning potential, and productivity (3,4). In low-income and middle-income regions, stunting rates can reach 30%–40% due to inadequate nutrition and limited healthcare access worldwide (5).Proper nutrition, physical activity, quality sleep, and mental health support are internationally accepted strategies to support height growth (6). Bone development requires a diet that is rich in protein, calcium, and vitamins D, A, and C (7). In addition, physical activities, such as stretching, swimming, and running, stimulate growth hormone production (6). Moreover,proper sleep, particularly 8–10 hours per night, is essential for the release of growth hormone (2).Additionally, growth during critical spurts (ages 11–13 for girls and 13–15 for boys) can be optimized in low-stress environments, Further, proper improvement in their lifestyle and its components is associated with higher height growth (4,8).In the Association of Southeast Asian Nations region, persistent stunting is driven by poverty, limited healthcare, and low awareness, with rates reaching up to 40% in some remote areas (5,6,8).
In Thailand, despite school lunch and milk programs, malnutrition and lack of physical activity continue to hinder growth (9,10). Community-level efforts face some challenges, such as limited resources, low parental awareness, and insufficient collaboration (11). Accurate height measurement is important to address these issues, though at-home measurements demonstrate no significant differences from clinic measurements (12). In Mae Hong Son Province, rural and remote areas and resource-limited settings often lack standardized equipment. Furthermore, some existing interventions are not interactive or engaging for children, protocols, and trained personnel (9).Misunderstanding height data can also affect children’s self-esteem and confidence (10).
Accordingly, there is a need for innovation. Among child-friendly educational tools, the Soong-dee magnet graph can play a critical role in this context; it integrates and interprets height by using the visual track and analyzes school-age children’s growth patterns according to their age and height. The current study aims to develop and assess educational tools (Soong-dee magnet graph) based on Social Cognitive Theory (SCT) in order to enhance height literacy and foster healthy behaviors in school-aged children (13).
Materials and Methods
Research Design
This study employed a quasi-experimental pre-post design without a control group to evaluate the effectiveness of the Soong-dee magnet graph as an educational intervention. The Soong-dee magnet graph is a visual educational tool designed to enhance height literacy and promote healthy behaviors. The design was selected due to practical constraints and ethical considerations in the real-world school setting, where withholding potentially beneficial health education from a control group was not feasible. The study integrated the development, implementation, and quantitative evaluation of the tool through pre-intervention and post-intervention assessments of knowledge and behavior. Based on SCT, the research aimed to develop and assess the effectiveness of this instrument in enhancing height literacy and promoting healthy behaviors among school-aged children in Mae Hong Son Province, remote areas of Thailand.
Research Setting
The study was conducted in Pha Bong and Pang Moo subdistricts, Mueang Mae Hong Son district, Mae Hong Son Province, Thailand. It is a remote, resource-limited setting, where there is limited access to healthcare and nutrition-related education. This area was selected due to its high prevalence of stunted growth, with 42.3% of children falling below the standard height in 2020 (14).
Participants/Sample
The study targeted school-aged children (9–14 years) enrolled in formal education in Mae Hong Son province. According to the school-age population data as of March 2023 (N = 823), a total of 60 participants were systematically sampled to ensure a representative sample.
Sampling and Sample Procedures
A systematic sampling method was employed to select participants from student enrollment lists provided by school administrators. It was chosen over simple random sampling due to its practical efficiency in school settings, where class rosters were already organized in lists, and full randomization would have been more time-consuming and logistically challenging. In addition, this method ensured a more even distribution across the list of eligible students while maintaining a degree of randomness. Further, the sampling interval was calculated by dividing the total number of eligible students (N = 823) by the desired sample size (n = 60), resulting in a sampling interval of approximately 14. A random starting point between 1 and 14 was chosen, and every 14th student on the list was selected thereafter. If the intended student did not meet the inclusion criteria or declined participation, the next eligible student on the list was chosen. The inclusion criteria required children aged 9–14 years who were enrolled in formal education, understood the study objectives, and provided informed assent, with parental or guardian consent obtained. On the other hand, the exclusion criteria applied to children who declined to participate or whose parents/guardians did not provide consent, as well as participants who withdrew during the study.
Underlying diseases were not considered as exclusion criteria because the study aimed to evaluate the effectiveness of the Soong-dee magnet graph under real-world school conditions, where students may present with a range of health backgrounds. Excluding children with underlying conditions might have limited the generalizability of the findings. Accordingly, the researchers focused on ensuring that participants were part of the general student population and able to engage in typical school activities, including the height promotion intervention.
Potential Sampling Biases
While systematic sampling ensured a structured and unbiased selection process, potential limitations remain. The study was performed in a single province and included only children enrolled in formal education, potentially excluding out-of-school youth or children from more marginalized groups. Moreover, students from schools with better administrative capacity may have been more likely to participate due to the cooperation required for data access and consent procedures. Thus, these factors may affect the generalizability of the findings to all children in similarly underserved regions.
Instruments
In this study, ‘height literacy’ refers to the knowledge, comprehension, and application of information related to child growth and height development, including the ability to interpret growth charts, evaluate influencing factors, and make informed health decisions to support growth.Four researcher-developed instruments were used to assess demographic information, height literacy, health behaviors, and user engagement with the Soong-dee Magnet Graph. The demographic questionnaire collected basic data, such as gender, age, weight, and height. The Height Literacy Questionnaire comprised five items rated on a 3-point Likert-type scale (1 = Low, 2 = Moderate, and 3 = High), yielding a total score range of 5–15; higher scores indicated better understanding of height-related health information. Content validity was established through expert judgment following a two-stage approach to content validity and the content validity ratio (CVR) framework (15,16). This tool demonstrated strong content validity (IOC = 0.91 and CVR values > 0.78) and good internal consistency (Cronbach’s alpha = 0.85), though it is not standardized. Furthermore, the Health Behavior Questionnaire included 10 dichotomous (Yes/No) items administered before and after the intervention. Each ‘Yes’ response scored 1 point (range 0–10), with higher scores indicating healthier behaviors. This tool also showed acceptable validity (IOC = 0.87 and CVR values > 0.62) and reliability (Cronbach’s alpha = 0.79). Content validity for all instruments was evaluated by three experts purposively selected based on (a) holding at least a master’s degree in public health, education, or a related discipline, (b) having a minimum of five years of experience in child growth, health behavior, or educational measurement, and (c) being previously involved in questionnaire development or validation. All experts independently reviewed each item for clarity, relevance, and representativeness, and their feedback was incorporated to refine the tools.
Procedure
The study was conducted in three phases over four months to assess the effect of the intervention.
Phase 1
This phase had two sections as follows:
simple
-
1. Development of the Soong-Dee Magnet Graph: This graph was designed as an interactive educational tool grounded in SCT to promote height literacy and healthy behaviors among school-aged children. The development process involved (1) content design, (2) visual and interactive features, (3) expert validation, and (4) pilot testing.
Content design: Key height growth determinants (e.g., nutrition, physical activity, sleep, and self-monitoring) were incorporated based on public health guidelines and expert consultations.
Visual and interactive features: The graph was designed with color-coded height zones, progress tracking markers, and simplified instructions to enhance user engagement. A magnetic mechanism allowed children to move markers along the height chart, thereby reinforcing learning through hands-on interaction.
Expert validation: A pediatrician, a nutritionist, and an educational specialist reviewed the prototype for scientific accuracy, usability, and cultural relevance. Their feedback guided revisions to ensure clarity and age-appropriateness.
Pilot testing: The tool was tested in 30 school-aged children to assess ease of use, comprehension, and engagement before full-scale implementation. Then, adjustments were made to improve accessibility and effectiveness.
simple
-
2. Pre-intervention assessment: In this process, participants were involved in completing a demographic questionnaire, height literacy assessment, and behavioral outcome survey to establish baseline data for comparison after the intervention. This phase provided essential insights into participants’ initial knowledge and behaviors related to height growth.
Phase 2: Intervention Implementation
In this phase, the Soong-dee magnet graph, an interactive height-tracking tool, was introduced through structured educational activities based on the constructs of SCT. Teacher training sessions included 90-minute workshops that educated teachers on height physiology, accurate measurement techniques, and interpreting growth patterns using the tool. In addition, student workshops consisted of 40-minute interactive lessons that covered nutrition, physical activity, sleep, and mental health, utilizing games and rewards, multimedia presentations, and group discussions with teacher encouragement. Additionally, height awareness activities engaged participants in 50-minute sessions where they measured, recorded, and interpreted their height using the Soong-dee magnet graph. These activities encouraged students to actively track their growth and discuss their progress with teachers.
Phase 3: Post-Intervention Evaluation
In this phase, participants’ height literacy and health behavior outcomes were reassessed using the same questionnaires from Phase 1. Furthermore, user engagement with the Soong-dee magnet graph was evaluated through a 5-item questionnaire. Then, data from the pre-intervention and post-intervention assessments were analyzed to measure changes in height literacy and health behaviors, thereby determining the effectiveness of the intervention in promoting height awareness and encouraging positive growth-related habits.
Data Analysis
Descriptive statistics, including frequencies, percentages, means, and standard deviations (SD), were used to summarize participant demographics, including gender and age distribution, as well as baseline and post-intervention height and weight. To evaluate the effectiveness of the Soong-dee magnet graph intervention, appropriate inferential statistical tests, including the paired samples t-test for continuous variables (e.g., height and weight), were employed to determine whether observed changes before and after the intervention were statistically significant. A significance level of P < .05 was utilized to determine statistical significance, and all data were analyzed using SPSS, version 22.0.
Ethical Considerations
This study was approved by the Institutional Review Board of Chiang Mai Rajabhat University (approval No. 2022/349.28.12, COA No. 349/2022). Moreover, informed consent was obtained from the parents or guardians of all students, ensuring that they understood the purpose, procedures, and potential risks involved in the study. Additionally, assent was obtained from the children, ensuring their voluntary participation. The confidentiality and privacy of all participants were strictly maintained throughout the study.
Results
Output of the Soong-Dee Magnet Graph Development
Graph features and age-appropriate visuals were separated by gender. The X-axis and Y-axis represent height (in centimeters) and age (years), respectively. The graph is constructed with a magnetic surface, allowing children to use a movable magnet marker to track their individual current height at the intersection with their age. In each row (age), a color-coded system indicated growth status: white, green, light green, blue, and orange for tall, moderately tall, normal height, moderately stunted, and stunted, respectively. For example, a 6-year-old boy with a height of 115 cm would mark his height at the intersection with age 6, which falls in the light green zone, indicating that his height is average compared to children of the same age and gender.
Interpretation of the graph: Height according to age is an indicator of long-term nutritional status and reflects whether a child’s height is appropriate for their age (17). Chronic nutrient deficiencies can affect structural growth, causing children to be shorter than their peers of the same age.
Interpretation of growth status: Growth status is categorized into five levels as follows:
Tall (white): Excellent growth, typically reflecting optimal nutrition and healthy development, which supports positive learning outcomes.
Moderately tall (green): Very good growth, associated with favorable health and developmental conditions.
Normal height (light green): Good growth, indicating adequate nutrition and overall physical and cognitive well-being.
Moderately stunted (blue): At risk of chronic malnutrition; if not addressed, growth may slow or stop, leading to stunting.
Stunted (orange): Chronic malnutrition; long-term inadequate food intake results in little to no height increase. This condition requires urgent intervention (Figures 1 and 2). This interactive feature enhances user engagement, encourages self-monitoring, and fosters a hands-on learning experience in height awareness and healthy growth behaviors.
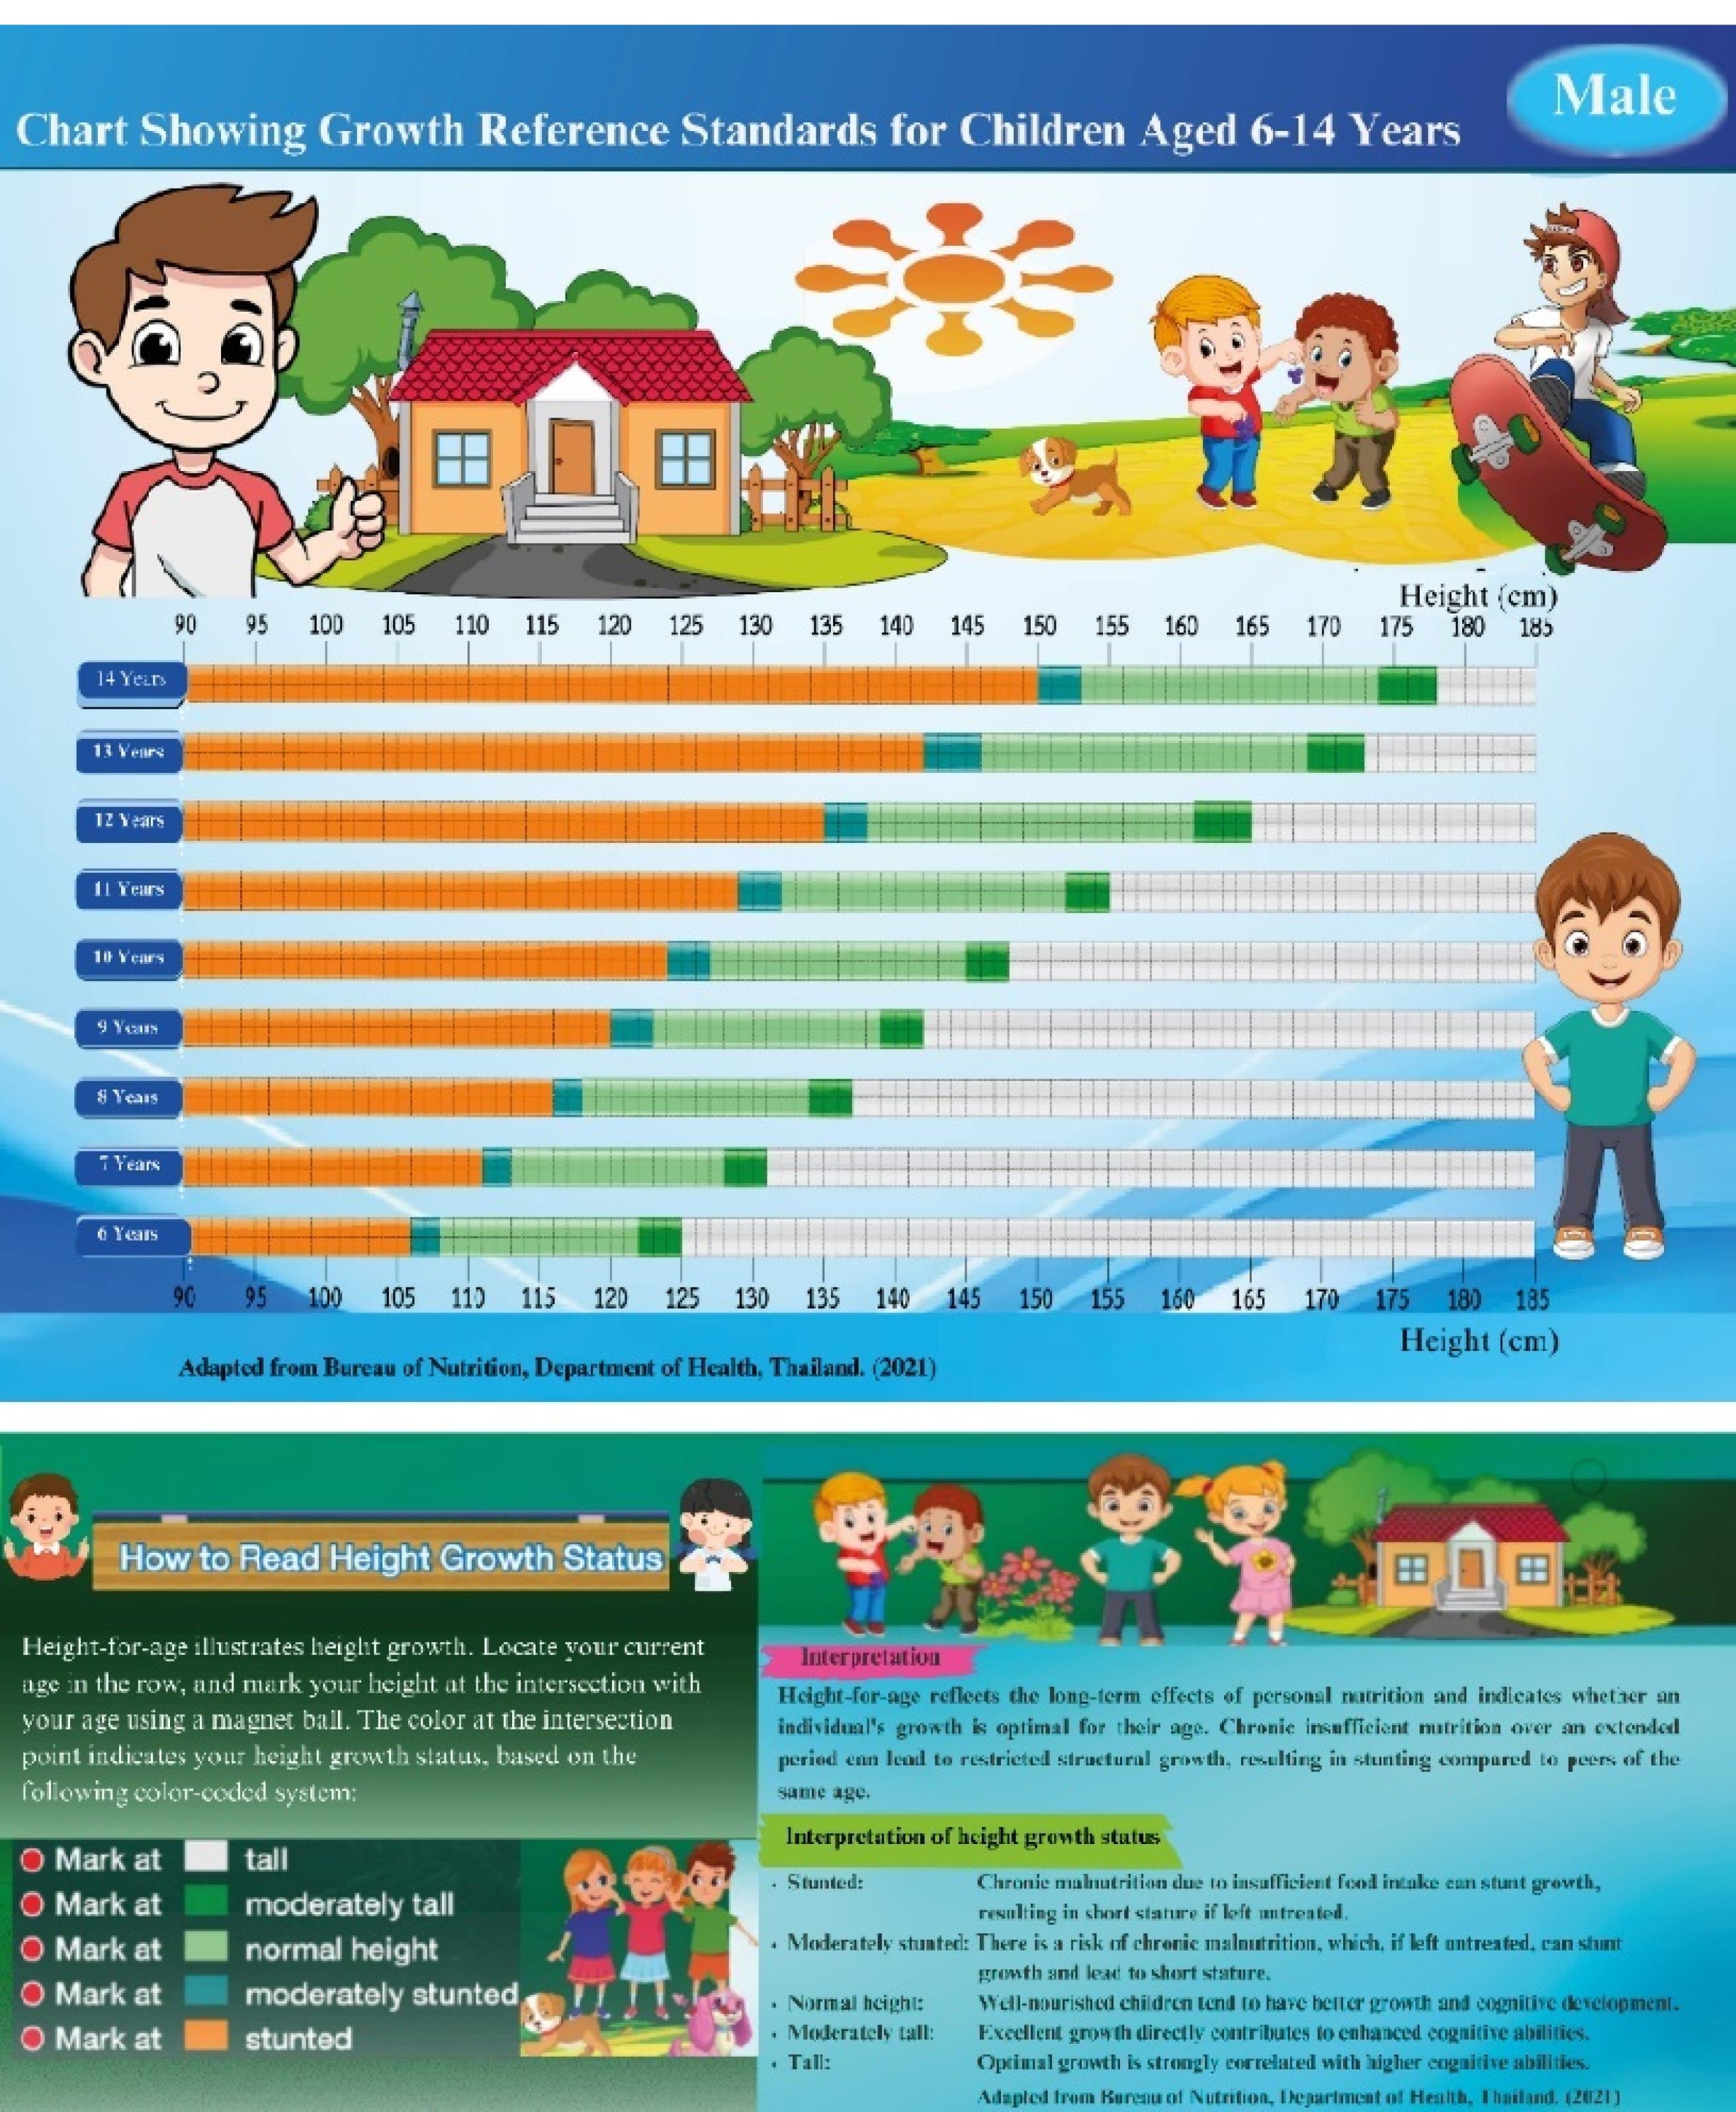
Figure 1.
The Soong-Dee Magnet Graph for Boys Aged 6–14 Years. Note. This educational tool promotes height growth awareness and benchmarks and milestones, while the Y-axis represents ages. cm: centimeters
.
The Soong-Dee Magnet Graph for Boys Aged 6–14 Years. Note. This educational tool promotes height growth awareness and benchmarks and milestones, while the Y-axis represents ages. cm: centimeters
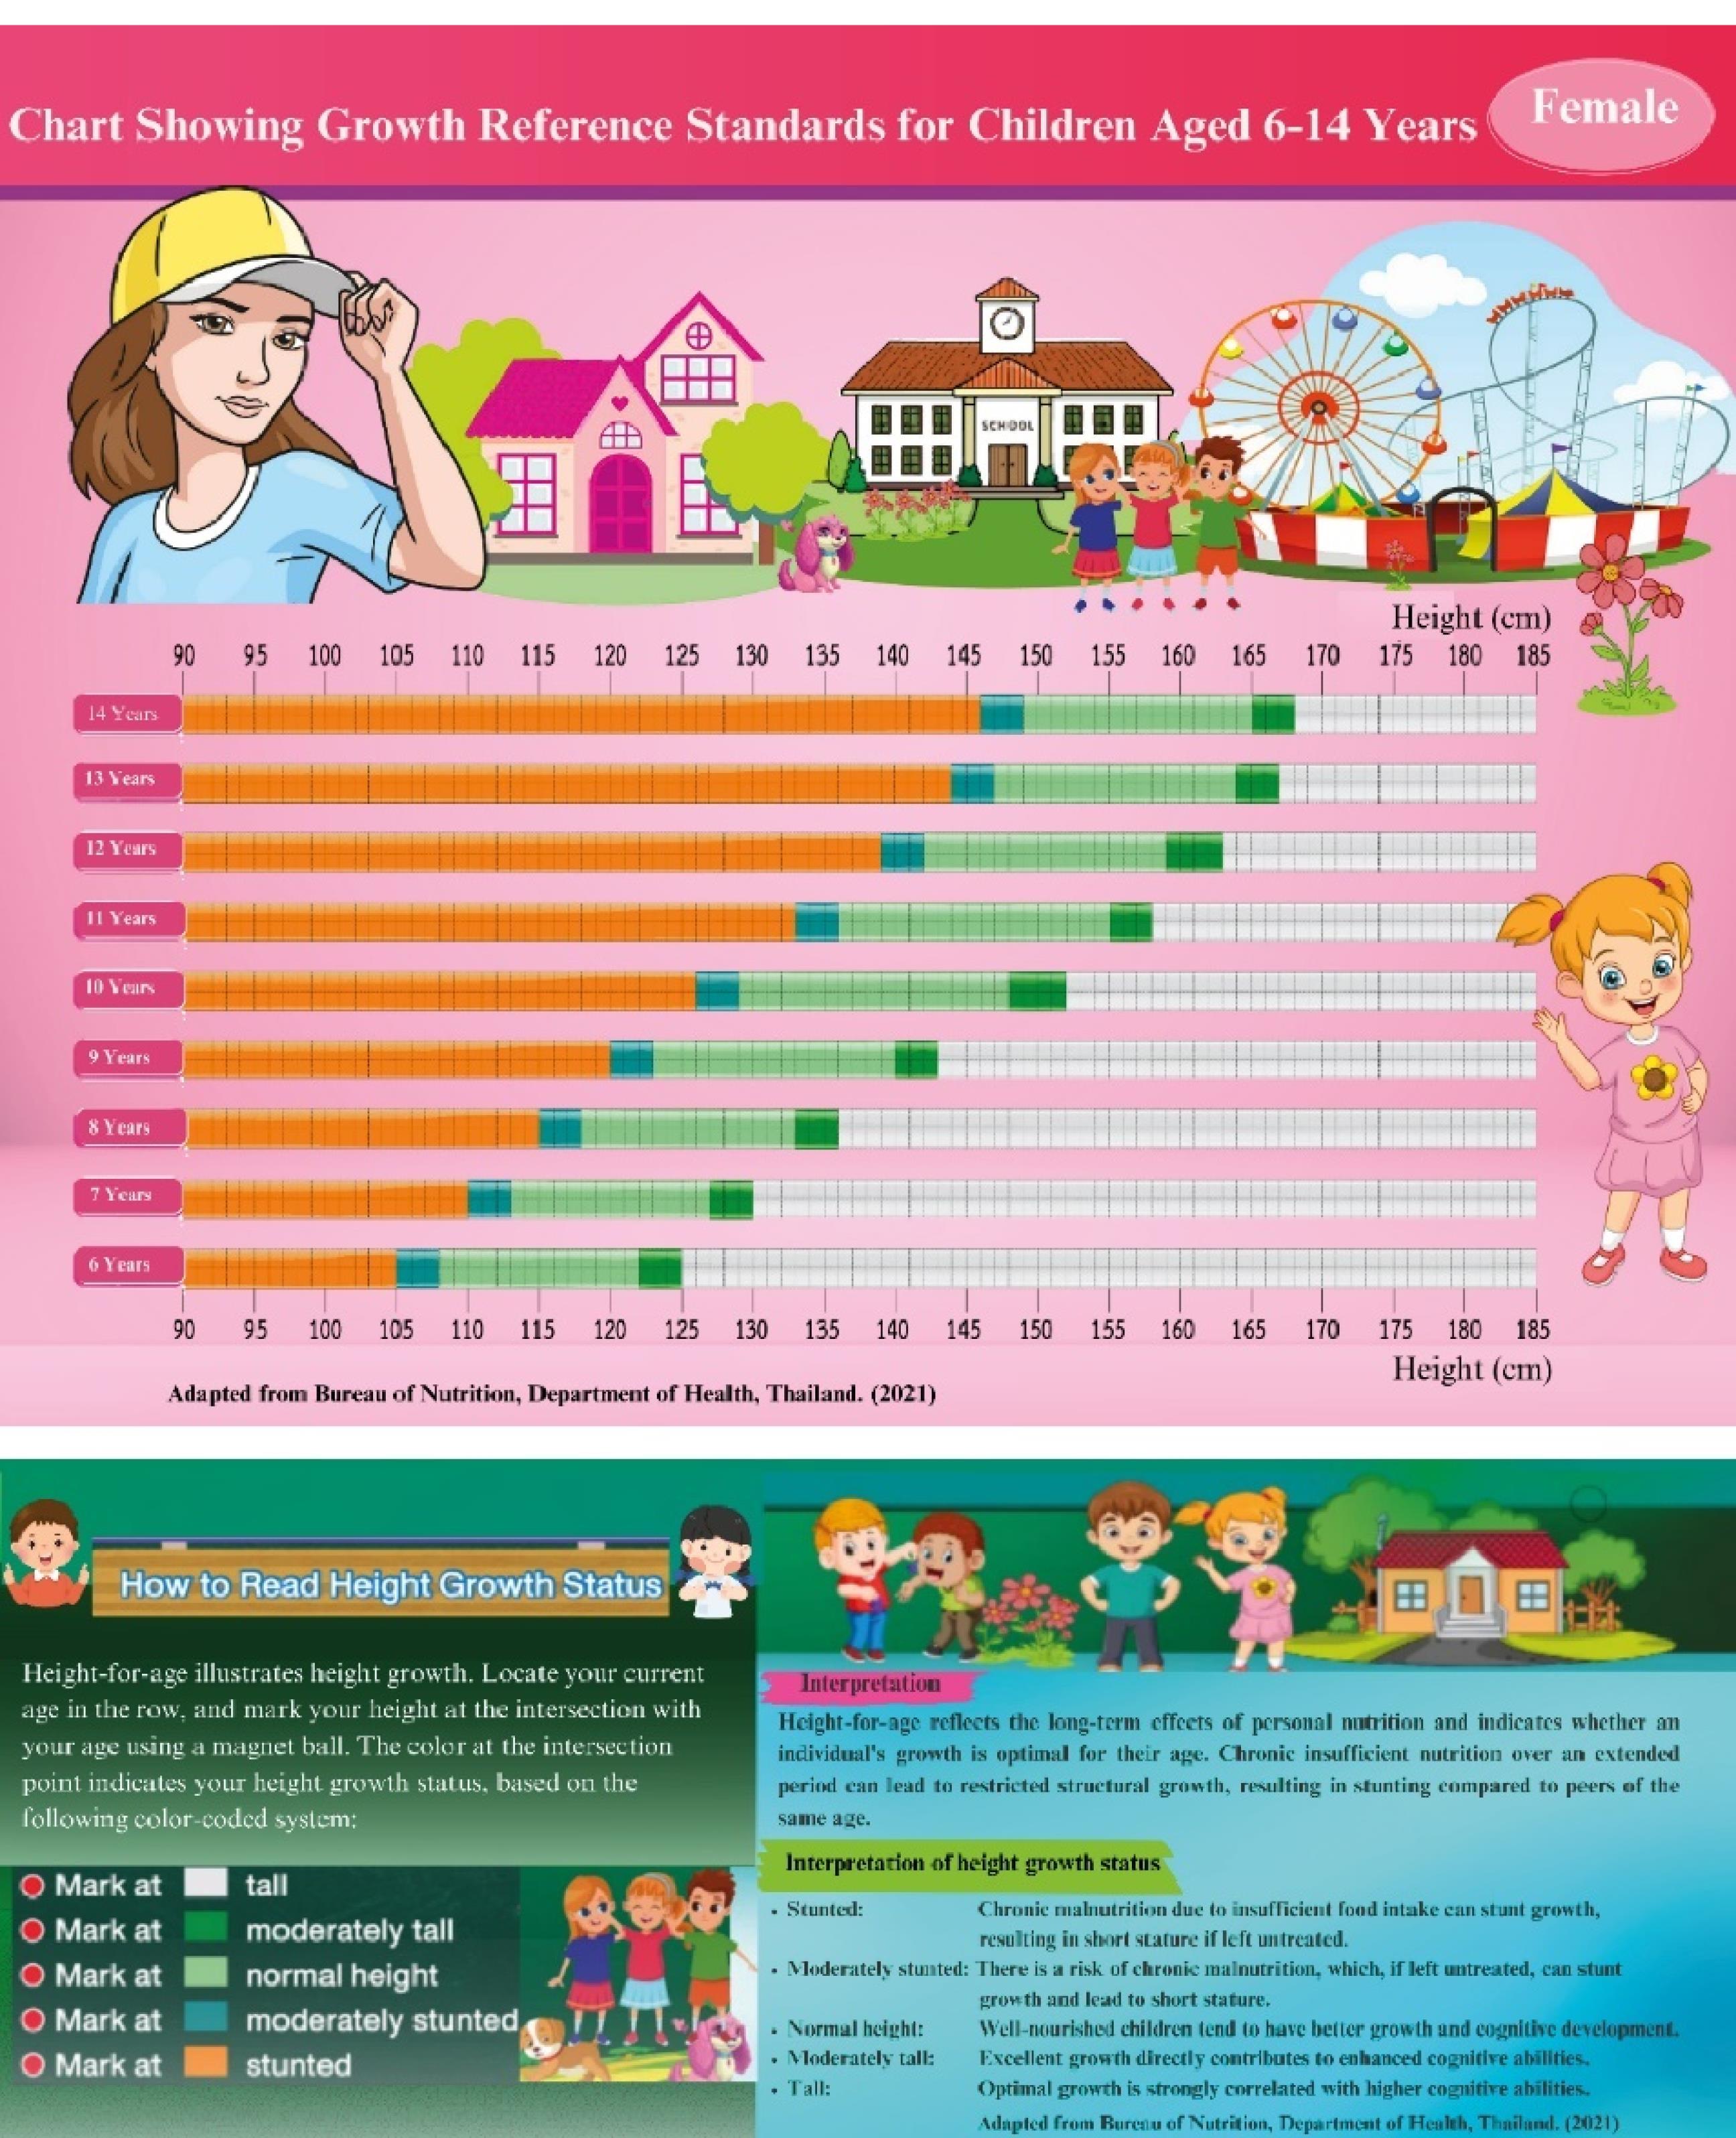
Figure 2.
The Soong-Dee Magnet Graph for Girls Aged 6–14 Years. Note. This educational tool promotes height growth awareness and benchmarks and milestones, while the Y-axis represents ages. cm: centimeters
.
The Soong-Dee Magnet Graph for Girls Aged 6–14 Years. Note. This educational tool promotes height growth awareness and benchmarks and milestones, while the Y-axis represents ages. cm: centimeters
Participant Demographics
The participants were 31 males (51.70%) and 29 females (48.30%). The age breakdown included 18 (30.00%), 26 (43.30%), and 16 (26.70%) respondents aged 9–10, 11–12, and 13–14 years old, respectively.
Comparison of the Effect Before and After Height Promotion
Following the height promotion intervention, both weight and height showed significant improvements among participating school-aged children.
More precisely, the mean weight increased from 38.56 kg (SD: 9.67) before the intervention to 41.26 kg (SD: 9.74) after the intervention. A paired samples t-test indicated that this increase was statistically significant [t (59): 6.12, P < .001]. Regarding weight categories, prior to the intervention, 46.7%, 36.7%, 13.3%, and 3.3% of participants were in the 21–36 kg, 37–52 kg, 53–68 kg, and 69–84 kg groups, respectively. Post-intervention, there was a slight redistribution with increases in the upper categories, suggesting positive weight gain trends.
Similarly, the mean height increased from 145.96 cm (SD: 9.58) pre-intervention to 148.25 cm (SD: 9.81) post-intervention, with the change being statistically significant [t (59): 7.89, P < .001]. Height category distributions also demonstrated a shift. Initially, 13.3% and 56.7% of children measured between 120 cm and 135 cm, as well as 136 cm and 150 cm, and 26.7% were between 151 cm and 165 cm. After the program, children in the lowest height group decreased to 8.3%, while the 136–150 cm and 151–165 cm groups increased to 58.3% and 30.0%, respectively. Post-intervention, 3.3% reached the 166–175 cm range.
These results confirmed that the height promotion intervention contributed to statistically significant improvements in both weight and height, underscoring its potential effectiveness in supporting physical development among school-aged children (Table 1).
Table 1.
Changes in Weight and Height of Participants Before and After the Height Promotion Intervention Using the Soong-Dee Magnet Graph (n = 60)
|
Variable
|
Before height promotion using a
Soong-Dee Magnet Graph
|
After height promotion using a
Soong-Dee Magnet Graph
|
t
|
P
value
|
| Current weight |
(Mean ± SD = 38.56 ± 9.67 kg) |
(Mean ± SD = 41.26 ± 9.74 kg) |
6.12 |
< 0.001 |
| 21-36 kg |
28 (46.7) |
26 (43.3) |
|
|
| 37-52 kg |
22 (36.7) |
23 (38.3) |
|
|
| 53-68 kg |
8 (13.3) |
9 (15.0) |
|
|
| 69-84 kg |
2 (3.3) |
2 (3.3) |
|
|
| Current height |
(Mean ± SD = 145.96 ± 9.58 cm) |
(Mean ± SD = 148.25 ± 9.81 cm) |
7.89 |
< 0.001 |
| 120-135 cm |
8 (13.3) |
5 (8.3) |
|
|
| 136-150 cm |
34 (56.7) |
35 (58.3) |
|
|
| 151-165 cm |
16 (26.7) |
18 (30.0) |
|
|
| 166-175 cm |
2 (3.3) |
2 (3.3) |
|
|
Note. SD: Standard deviation. Both weight and height showed statistically significant increases following the Soong-dee magnet graph height promotion intervention (P < .001 for both variables).
Height Literacy
After height promotion using a Soon-dee magnet graph, the results (Table 2) indicated a significant increase in the height literacy score (P < 0.001) across all assessed variables. The three highest increases were interpreting a height growth chart (mean ± SD: 1.62 ± 0.52), followed by understanding height measurement importance (mean ± SD: 1.38 ± 0.83) and knowledge of nutrition role in growth (mean ± SD: 1.28 ± 0.69), respectively.
Table 2.
Differences in Height Literacy Scores Before and After Height Promotion Using the Soong-Dee Magnet Graph, Analyzed With Paired Sample T-Test (n = 60)
|
Variables
|
Mean±SD
|
95% CI
|
t
|
df
|
P
value*
|
| Understanding height measurement importance |
1.38 ± 0.83 |
1.17 - 1.60 |
15.98 |
59 |
< 0.001** |
| Interpreting a height growth chart |
1.62 ± 0.52 |
1.48 - 1.75 |
23.91 |
59 |
< 0.001** |
| Knowing about nutrition’s role in growth |
1.28 ± 0.69 |
1.11 - 1.46 |
14.38 |
59 |
< 0.001** |
| Knowing about exercise’s role in growth |
1.15 ± 0.55 |
1.01 - 1.29 |
16.29 |
59 |
< 0.001** |
| Knowing about sleep’s role in growth |
1.25 ± 0.73 |
1.06 - 1.44 |
13.30 |
59 |
< 0.001** |
Note. Mean ± SD represents the mean difference and standard deviation of the difference between pre-intervention and post-intervention scores.
A positive mean indicates an improvement after the intervention. *P< 0.01 is considered statistically significant.
CI: Confidence interval; df: Degree of freedom; SD: Standard deviation; t: T-statistic.
** indicates statistical significance at p<0.001
Health Behavior
The results showed that the health behavior score significantly increased after the intervention (P < 0.001) across all evaluated variables. The five highest increases were related to spending free time at home and school staying active or exercising (mean ± SD: 1.70 ± 0.56), follow by exercising outdoor (mean ± SD: 1.68 ± 0.60), sleeping 8–10 hours a day (mean ± SD: 1.02 ± 0.83), measuring and interpreting height (mean ± SD: 0.97 ± 0.94), and staying active exercise (mean ± SD: 0.93 ± 0.88), respectively (Table 3).
Table 3.
Changes in Health Behaviors Before and After Height Promotion Using a Soong-Dee Magnet Graph: Analysis With Paired Sample T-Test Statistics (n = 60)
|
Variables
|
Mean±SD
|
95% CI
|
t
|
df
|
P
Value*
|
| Exercising for 15-30 minutes per day or 150 minutes per week |
0.40 ± 0.72 |
0.22-0.86 |
4.32 |
59 |
< 0.001** |
| Staying active and exercise |
0.93 ± 0.88 |
0.71-1-16 |
8.21 |
59 |
< 0.001** |
| Spending free time at home and school staying active or exercising |
1.70 ± 0.56 |
1.56-1.85 |
23.45 |
59 |
< 0.001** |
| Exercising outdoors |
1.68 ± 0.60 |
1.19-1.61 |
13.11 |
59 |
< 0.001** |
| Paying attention to eating all five food groups |
0.60 ± 0.81 |
1.53-1.84 |
21.86 |
59 |
< 0.001** |
| Consulting a teacher or parent about foods |
0.73 ± 0.92 |
0.39-0.81 |
5.76 |
59 |
< 0.001** |
| Sleeping 8-10 hours a day |
1.02 ± 0.83 |
0.50-0.97 |
6.19 |
59 |
< 0.001** |
| Measuring and interpreting height |
0.97 ± 0.94 |
0.72-1.21 |
7.98 |
59 |
< 0.001** |
| Using equipment provided by the school and community to promote weight |
0.87 ± 0.91 |
0.80-1.23 |
9.45 |
59 |
< 0.001** |
| Using facilities provided by the school and community to promote height |
0.87 ± 0.91 |
0.63-1.10 |
7.37 |
59 |
< 0.001** |
Note. Values are reported as mean difference ± standard deviation (post-test minus pre-test). P <.01 indicates a statistically significant difference (two-tailed).
CI: Confidence interval; df: Degrees of freedom; SD: Standard deviation; t: T-statistic.
** indicates statistical significance at p<0.001
Effect of the Soong-Dee Magnet Graph on User Engagement
Based on the results of user engagement in the Soong-dee magnet graph after the intervention, ease of use (mean ± SD: 2.88 ± 0.32), an understanding of growth progress (2.93 ± 0.25), enjoyment of tracking height (2.97 ± 0.18), confidence in maintaining a healthy lifestyle (2.86 ± 0.34), and belief in tracking height (2.86 ± 0.34) led to actual growth improvement and willingness to recommend the tool, respectively.
Discussion
The findings demonstrated a significant improvement in height literacy, health behaviors, and physical growth among school-age children following the intervention using the Soong-dee Magnet Graph. After the intervention, there were statistically significant increases in both weight (from 38.56 ± 9.67 kg to 41.26 ± 9.74 kg; t (59): 6.12, P < 0.001) and height (from 145.96 ± 9.58 cm to 148.25 ± 9.81 cm; t (59): 7.89, P < 0.001), highlighting measurable physical development during the program period.
In terms of height literacy, significant improvements were observed across all five knowledge domains. The largest gain was found in interpreting a height growth chart (mean ± SD: 0.52 ± 1.62, P < 0.001), followed by a better understanding of the importance of height measurement and knowledge of nutrition, exercise, and sleep in relation to growth. These findings emphasize the effectiveness of visual and interactive tools in improving children’s conceptual understanding of height-related health knowledge.
Similarly, health behaviors significantly improved across all ten measured indicators. Notable changes included increased engagement in physical activity during free time (mean ± SD: 1.70 ± 0.56), outdoor exercise (mean ± SD: 1.68 ± 0.60), and adequate sleep (mean ± SD: 1.02 ± 0.83), with all behaviors showing P < 0.001. These improvements suggest that height promotion interventions grounded in SCT can effectively foster healthier routines when implemented in school-based settings.
These findings align with those of prior studies, indicating that child-friendly educational interventions can improve health knowledge, attitudes, and behaviors (18,19). The integration of physical activity, nutrition education, sleep hygiene, and self-monitoring into a cohesive framework contributes to comprehensive child development, especially in rural or low-resource environments.
Based on the results, the Soong-dee magnet graph facilitated height literacy by providing a visually engaging and easy-to-understand resource. This encouraged some healthy activities, such as proper nutrition, physical activity, and adequate sleep. It is noteworthy that growth charts play a crucial role in monitoring development and assessing an individual’s height relative to peers (20).Previous studies indicated that school-based interventions (e.g., nutrition education) in school significantly improve school children’s health and nutrition outcomes in low-income and middle-income countries (21,22). Moreover, educational programs on nutrition and health behavior can lead to better growth outcomes and reduced stunting (23). Community-level challenges, such as limited resources and low parental awareness (24), highlight the need for accessible intervention tools that promote self-reliance in height and health behavior awareness (e.g., the Soong-dee magnet graph). These strategies align with global recommendations from UNICEF, which advocates for comprehensive approaches to reduce stunting and support optimal growth (25).
This study also supports the theoretical foundations of SCT, which explains health behavior as the result of reciprocal interactions between personal factors, behavioral patterns, and environmental influences (13). The intervention’s effectiveness conforms to previous findings, demonstrating the utility of SCT in guiding behavior change among children and adolescents. SCT-based interventions have been shown to reduce sugar-sweetened beverage consumption (26), improve physical activity through enhanced self-efficacy and outcome expectations (27), and strengthen health self-efficacy across various educational levels (28).
Evidence also highlights the success of school-based strategies incorporating child-friendly elements (e.g., goal-setting, visual tools, and parental involvement) in promoting sustained improvements in physical activity and health behaviours (29). Furthermore, integrating SCT with family systems theory has improved dietary behaviors in younger children, particularly when supportive parenting strategies are reinforced (30). These findings affirm the broad applicability of SCT in shaping positive health behaviors across developmental stages.
The present study extends this evidence by demonstrating the effectiveness of the Soong-Dee Magnet Graph in enhancing height literacy, promoting healthier routines, and increasing student engagement. Grounded in SCT principles (e.g., self-monitoring, environmental cues, and observational learning), the intervention fostered sustainable behavior change among school-aged children in a low-resource, remote setting, thereby reinforcing SCT’s relevance in practical, community-based applications.
Reciprocal Determinism
The intervention helped achieve an interactive learning environment where the children used the Soong-Dee Magnet Graph to track their height changes as they grew older. The observed changes in height literacy (e.g., understanding of height charts and the importance of height measurement) indicated greater knowledge and behavioral change due to the environment: the graph. This follows the SCT tenet that behavioral change is the result of the combination of personal cognition and stimuli from the environment.
Behavioral Capability
Children showed increased knowledge and skills about height growth as demonstrated by the increased nutrition literacy and comprehension of growth charts. Recognizing the importance of having the appropriate knowledge and skills necessary to perform the desired behavior as per SCT is known as behavioral capability.
Observational Learning
Although not directly measured, children appeared more likely to engage with the graph after observing peers’ interactions, indicating observational learning. This is in line with the key concepts of SCT, particularly the role of peer modeling in behavior change (13,20).Notably, the observed effects also reflect the principles of SCT, which is well-suited to elementary school children and emphasizes learning through observation (31). Thus, future studies might explore the influence of role models (e.g., teachers or parents) in reinforcing these behaviors.
Reinforcement
The moderate to vigorous physical activities and health-enhancing behaviors were so high. Accordingly, it is reasonable to assume that children obtained some form of positive reinforcement from utilizing the tool. It should be noted that the study did not evaluate reinforcement factors (e.g., teacher’s praises or parental rewards). Therefore, more studies should delve into how motivational rewards affect participation in height-increasing activities.
Outcome Expectations and Self-regulation
The children who played with the Soong-Dee Magnet Graph were willing to endorse the tool to a great extent. Their behavior displayed positive outcome expectations, which is the belief that tracking height and engaging in healthy activities would produce expected results. In addition, bordering on cognitive self-regulation, the ability to observe and understand their own growth is the capability that is a core concept of SCT, which enables most people to set health objectives for themselves and accomplish them without external control.
Importantly, this study also addressed a critical public health gap by targeting children in Mae Hong Son, a remote border province. Children in such underserved areas often face compounding barriers, including limited access to health services, low parental literacy, and inadequate educational infrastructure (32). The low-cost and adaptable format of the Soong-Dee Magnet Graph supports scalability, offering a practical solution for promoting growth awareness and behavior change in rural or culturally diverse contexts.
Strengths and Limitations
Strengths
This study introduced a novel, low-cost, and engaging educational tool, the Soong-Dee Magnet Graph, designed to promote health-related behaviors among children in underserved areas. The findings revealed that its visual and interactive format is well-suited for enhancing comprehension and motivation in young learners. Moreover, the adaptability of this instrument across age groups and languages highlights its potential for broader implementation in diverse cultural and educational contexts. Additionally, the positive outcomes observed in this study support the feasibility and acceptability of the intervention in real-world settings.
Limitations
Despite these promising findings, several limitations must be acknowledged. The relatively small sample size (n = 60) restricted the generalizability of the results. In addition, the absence of a control group limited causal inference, making it difficult to attribute improvements solely to the intervention. However, this design decision reflected a pragmatic, real-world approach to school-based health education, where controlled trials may not always be feasible. Additionally, the short follow-up period hindered the evaluation of long-term behavioral changes or growth outcomes. Another limitation was the absence of incentive mechanisms for participants, which could have influenced motivation, engagement, and response accuracy. While the intervention itself was designed to be intrinsically engaging, future studies might consider structured incentive factors to enhance participation and sustain behavioral change.
Moreover, other studies should employ larger randomized controlled trials with extended follow-up durations and incorporate objective health indicators to assess sustained impact.
Conclusion
A height promotion thatintegrates with the Soong-Dee Magnet Graph within an educational setting successfully enhanced height literacy and promoted health behaviors among school-aged children. These findings underscore the importance of interactive educational tools in fostering behavioral change through SCT principles. Accordingly, future studies should take into account larger, randomized controlled trials with extended follow-up periods and include long-term health outcome assessments to strengthen the evidence base. Eventually, incorporating peer modeling, reinforcement strategies, and sustained monitoring will be critical for optimizing SCT-based interventions aimed at promoting healthy growth among children.
Acknowledgements
The author gratefully acknowledges the support of Thailand Science Research and Innovation and Chiang Mai Rajabhat University for their funding through the grant provided for this research.
The Magnet Graph tools utilized in this study, namely, “Magnet Graph for Interpreting Height in Boys Aged 6–14 Years” and “Magnet Graph for Interpreting Height in Girls Aged 6–14 Years”, were developed and copyrighted by the authors and the research team. These works have been officially registered with the Department of Intellectual Property, Ministry of Commerce, Thailand, a: (1) Magnet Graph for Boys (registration No. ศ.3.004165; application No. 436687) and (2) Magnet Graph for Girls (registration No. ศ.3.004166; application No. 436688). These copyrighted educational tools served as the foundation for the interactive intervention implemented in this study.
Competing Interests
The author has no competing interests associated with the material presented in this paper.
Ethical Approval
This study was approved by the Chiang Mai Rajabhat University Institutional Review Board (IRBCMRU) under approval number 2022/349.28.12, COA No. 349/2022.
Funding
Grants and funding for this research were received from Thailand Science Research and Innovation and Chiang Mai Rajabhat University.
References
- World Health Organization (WHO). Child Growth Standards. Geneva: WHO; 2020. Available from: https://www.who.int/tools/child-growth-standards. Accessed December 22, 2024.
- de Onis M, Branca F. Childhood stunting: a global perspective. Matern Child Nutr 2016; 12(Suppl 1):12-26. doi: 10.1111/mcn.12231 [Crossref] [ Google Scholar]
- de Onis M, Blössner M, Borghi E. Prevalence and trends of stunting among pre-school children, 1990-2020. Public Health Nutr 2012; 15(1):142-8. doi: 10.1017/s1368980011001315 [Crossref] [ Google Scholar]
- Black RE, Victora CG, Walker SP, Bhutta ZA, Christian P, de Onis M. Maternal and child undernutrition and overweight in low-income and middle-income countries. Lancet 2013; 382(9890):427-51. doi: 10.1016/s0140-6736(13)60937-x [Crossref] [ Google Scholar]
- World Health Organization (WHO). Global Nutrition Policy Review 2016-2017: Country Progress in Creating Enabling Policy Environments for Promoting Healthy Diets and Nutrition. Geneva: WHO; 2018. Available from: https://www.who.int/publications/i/item/9789241514873. Accessed December 23, 2024.
- United Nations Children’s Fund (UNICEF). The State of the World’s Children 2019: Children, Food and Nutrition: Growing Well in a Changing World. New York: UNICEF; 2019. Available from: https://digitallibrary.un.org/record/3896035?v=pdf. Accessed December 19, 2024.
- World Health Organization (WHO). Essential Nutrition Actions: Improving Maternal, Newborn, Infant and Young Child Health and Nutrition. Geneva: WHO; 2013. Available from: https://www.who.int/publications/i/item/9789241505550. Accessed December 22, 2024.
- Vaziri Esfarjani S, Zamani M, Ashrafizadeh SS, Zamani M. Association between lifestyle and height growth in high school students. J Family Med Prim Care 2023; 12(12):3279-84. doi: 10.4103/jfmpc.jfmpc_8_23 [Crossref] [ Google Scholar]
- National Statistical Office of Thailand. Thailand Multiple Indicator Cluster Survey 2022. Bangkok, Thailand: National Statistical Office; 2022. Available from: https://www.unicef.org/thailand/reports/thailand-multiple-indicator-cluster-survey-2022. Accessed December 27, 2024.
- United Nations Children’s Fund (UNICEF). The State of the World’s Children 2021: On My Mind: Promoting, Protecting and Caring for Children’s Mental Health. New York: UNICEF; 2021. Available from: https://www.unicef.org/reports/state-worlds-children-2021. Accessed December 19, 2024.
- National Health Security Office. NHSO Annual Report Fiscal Year 2021. Bangkok, Thailand: Ministry of Public Health; 2021. Available from: https://eng.nhso.go.th/assets/portals/1/files/nhso%20report%20fiscal%20year%202022%20-%20Copy.pdf. Accessed December 27, 2024.
- Zhang E, Davis AM, Jimenez EY, Lancaster B, Serrano-Gonzalez M, Chang D. Validation of remote anthropometric measurements in a rural randomized pediatric clinical trial in primary care settings. Sci Rep 2024; 14(1):411. doi: 10.1038/s41598-023-50790-1 [Crossref] [ Google Scholar]
- Bandura A. Social Foundations of Thought and Action: A Social Cognitive Theory. Englewood Cliffs, NJ: Prentice-Hall; 1986.
- Ministry of Health. Health Data Center. 2020. Available from: https://hdc.moph.go.th/center/public/standard-report-detail/e28682b2718e6cc82b8dbb3e00f2e28e. Accessed January 2, 2025.
- Lawshe CH. A quantitative approach to content validity. Pers Psychol 1975; 28(4):563-75. doi: 10.1111/j.1744-6570.1975.tb01393.x [Crossref] [ Google Scholar]
- Lynn MR. Determination and quantification of content validity. Nurs Res 1986; 35(6):382-5. doi: 10.1097/00006199-198611000-00017 [Crossref] [ Google Scholar]
- Bureau of Nutrition. Growth Chart. 2021. Available from: https://nutrition2.anamai.moph.go.th/th/kidgraph. Accessed January 2, 2025.
- Sharma N, Asaf A, Vaivada T, Bhutta ZA. Delivery strategies supporting school-age child health: a systematic review. Pediatrics 2022; 149(Suppl 5):e2021053852L. doi: 10.1542/peds.2021-053852L [Crossref] [ Google Scholar]
- Enabnit A, Tangella K, Warren A. Height Assessment: A Comprehensive Guide to Tracking Growth and Development. 2023. Available from: https://www.dovemed.com/health-topics/focused-health-topics/height-assessment-comprehensive-guide-tracking-growth-and-development. Accessed December 27, 2024.
- Marsigliante S, Ciardo V, Di Maglie A, My G, Muscella A. Efficacy of school-based intervention programs in reducing overweight: a randomized trial. Front Nutr 2022; 9:1001934. doi: 10.3389/fnut.2022.1001934 [Crossref] [ Google Scholar]
- Bhutta ZA, Das JK, Rizvi A, Gaffey MF, Walker N, Horton S. Evidence-based interventions for improvement of maternal and child nutrition: what can be done and at what cost?. Lancet 2013; 382(9890):452-77. doi: 10.1016/s0140-6736(13)60996-4 [Crossref] [ Google Scholar]
- Food and Agriculture Organization of the United Nations (FAO). Improving Nutrition of School Age Kids Through Nutrition-Sensitive Food System Approach. FAO; 2021. Available from: https://openknowledge.fao.org/server/api/core/bitstreams/c4b0e766-6f4b-4add-b9cb-2602170a914f/content. Accessed December 28, 2024.
- Singhal N, Misra A, Shah P, Gulati S. Effects of controlled school-based multi-component model of nutrition and lifestyle interventions on behavior modification, anthropometry and metabolic risk profile of urban Asian Indian adolescents in North India. Eur J Clin Nutr 2010; 64(4):364-73. doi: 10.1038/ejcn.2009.150 [Crossref] [ Google Scholar]
- Moore N, Lane C, Storhaug I, Franich A, Rolker H, Furgeson J, et al. The Effects of Food Systems Interventions on Food Security and Nutrition Outcomes in Low- and Middle-Income Countries. International Initiative for Impact Evaluation (3ie); 2021. Available from: https://www.3ieimpact.org/sites/default/files/2021-01/EGM16-GIZ-FSN.pdf. Accessed December 27, 2024.
- United Nations Children’s Fund (UNICEF). Nutrition for Every Child: UNICEF Nutrition Strategy 2020-2030. New York: UNICEF; 2020. Available from: https://www.unicef.org/media/92031/file/UNICEF%20Nutrition%20Strategy%202020-2030.pdf. Accessed December 19, 2024.
- Sharafkhani N, Paknahad Z, Heidari Z, Mostafavi F. The effects of an educational program based on social cognitive theory in adopting behaviors to prevent excessive consumption of sugar-sweetened beverages in children: application of shad social network software. J Pediatr Perspect 2022; 10(6):16182-94. doi: 10.22038/ijp.2021.57727.4526 [Crossref] [ Google Scholar]
- Shirvani H, Sanaeinasab H, Tavakoli R, Saffari M, Khalaji K, Me’mar S. The effect of a social cognitive theory-based educational intervention on the physical activity of female adolescents. Iran J Health Educ Health Promot 2017; 4(4):309-18. doi: 10.18869/acadpub.ihepsaj.4.4.309 [Crossref] [ Google Scholar]
- Dubovi AS, Sheu HB. Testing the effectiveness of an SCT-based training program in enhancing health self-efficacy and outcome expectations among college peer educators. J Couns Psychol 2022; 69(3):361-73. doi: 10.1037/cou0000592 [Crossref] [ Google Scholar]
- Savolainen E, Rutberg S, Backman Y, Lindqvist AK. Long-term perspectives of a school-based intervention to promote active school transportation. Int J Environ Res Public Health 2020; 17(14):5006. doi: 10.3390/ijerph17145006 [Crossref] [ Google Scholar]
- Shakerinejad G, Dehghani SL, Zolghadr R, Baboli Z, Nejadsadeghi E. Effectiveness of a social cognitive theory and family system theory-based intervention in improving eating behaviors in preschool children. Ital J Pediatr 2025; 51(1):125. doi: 10.1186/s13052-025-01967-z [Crossref] [ Google Scholar]
- Widodo A, Astuti B. Critical analysis of social cognitive learning theory and its implementation in elementary schools. MANDALIKA J Soc Sci 2024; 2(1):6-12. doi: 10.56566/mandalika.v2i1.148 [Crossref] [ Google Scholar]
- United Nations Children’s Fund (UNICEF). UNICEF Thailand Impact Report 2023. Bangkok: UNICEF; 2023. Available from: https://www.unicef.org/thailand/reports/unicef-thailand-impact-report-2023. Accessed May 19, 2025.